A CPU and memory profiler for the .NET platform, recognized by the IT professionals and analysts as the best profiling tool out there. #CPU profiler #Memory profile #Software profiler #Profile #Profiler #CPU
Profiling your application from the standpoint of CPU and memory usage is quite important, as it enables you to optimize its performance and limit its impact on the host system resources, which is always appreciated by end-users.
With the help of YourKit Java Profiler, you can easily run your Java-based program and assess its functioning, analyzing and measuring several aspects of its runtime, enabling you to determine what could be improved.
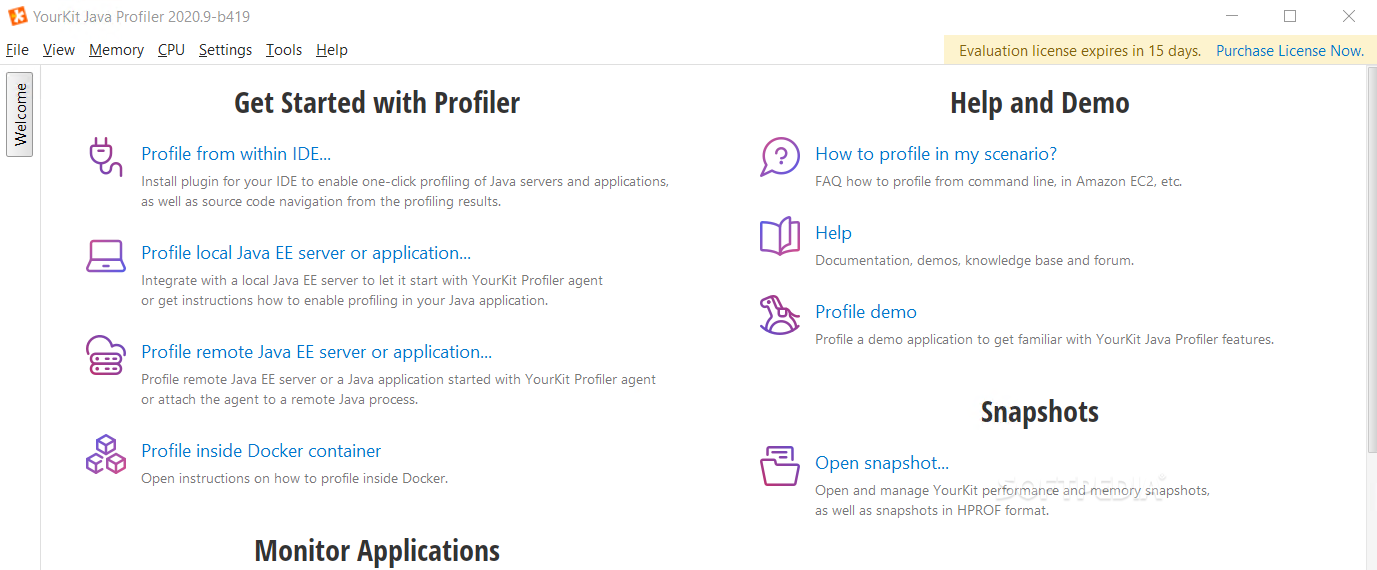
Subsequent to the brief setup process, you can launch the program, its ‘Welcome’ screen allowing you to view locally running Java apps, or work with the ‘Integration Wizards’ to enable you to use a preferred development environment with YourKit Java Profiler.
Similarly, you can open and monitor remote utilities, or you can work with an existing snapshot. The dense documentation provides you with information on every aspect that may need clarification while the ‘Example’ lets you play with YourKit Java Profiler and learn what it is capable of.
After opening the Java tool that you want to profile, you can ‘Connect to Application’ from the context menu and start visualizing its performance. As such, you can view the CPU-related data, in the form of call trees or methods list, with details about ‘Time’ and ‘Invocation Count’. It even features ‘CPU Usage Telemetry’ in the shape of easy-to-interpret graphs.
From the ‘Threads’ tab, you can learn more about ‘Stack Traces’ and ’CPU Usage Estimation’, while in the ‘Deadlocks’ section, you can find all such events that have occurred so far. Moreover, YourKit Java Profiler enables you to explore objects whose memory screenshots you need to capture, letting you display ‘Allocations’ and ‘Memory & GC Telemetry’ data.
You can uncover details about ‘Exceptions’ and ‘Monitor Usage’. The automatically generated ’Performance Charts’ let you visualize information in a schematic manner while the ‘Events’ section lets you obtain an overview of important occurrences in the profiling process.
All these details along with the data in the ‘Summary’ enables you to discover which areas of your application require improvement, to optimize them for various systems and lower their overall impact.
In closing, YourKit Java Profiler is an advanced and useful software solution which aims to assist developers in running CPU and memory profiling tasks on Java-based tools, providing you with the information required to optimize them.
What's new in YourKit Profiler 2024.3 Build 152:
- IntelliJ IDEA 2024.1 is supported.
- The bundled runtime has been updated.
YourKit Profiler 2024.3 Build 152
add to watchlist add to download basket send us an update REPORT- runs on:
-
Windows 11
Windows 10 32/64 bit
Windows 2008 R2
Windows 2008 32/64 bit
Windows 2003
Windows 8 32/64 bit
Windows 7 32/64 bit
Windows Vista 32/64 bit
Windows XP 32/64 bit - file size:
- 77.5 MB
- filename:
- YourKit-JavaProfiler-2024.3-b152-x64.exe
- main category:
- Programming
- developer:
- visit homepage
Bitdefender Antivirus Free

Microsoft Teams

Zoom Client

Windows Sandbox Launcher

calibre

7-Zip

IrfanView

Context Menu Manager

ShareX

4k Video Downloader

- Context Menu Manager
- ShareX
- 4k Video Downloader
- Bitdefender Antivirus Free
- Microsoft Teams
- Zoom Client
- Windows Sandbox Launcher
- calibre
- 7-Zip
- IrfanView