Investigate ETW information (ETL files) and CLR memory information (heap dumps), as well as collect and view data in a user-friendly environment. #CPU performance #Memory performance #Performance analyzer #Perfromance #Analyzer #CPU
PerfView is a lightweight and portable software application that supplies you with the necessary tools for analyzing ETW information (ETL files) and CLR memory data (heap dumps). It features several advanced options that should come to your aid.
Provided that you have .NET Framework installed on your PC, you don't need to set up anything else. This means that you can save the app directory anywhere on the disk or on a removable storage unit and just click the .exe to launch PerfView. More importantly, it doesn't modify Windows registry settings, so it doesn't increase the risk of OS stability issues.
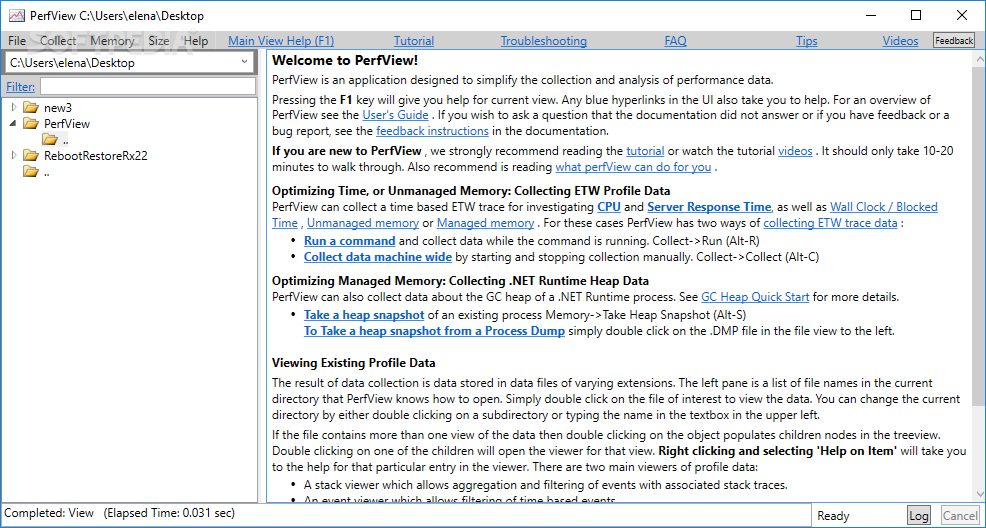
Made from a large window with a clear-cut structure, the interface is user-friendly, enabling you to use a folder-based structure to navigate directories and locate ETL and CLR files to investigate.
It's possible to refresh the contents of the currently selected directory, delete, rename or merge folders, make local symbol directories, compress files into ZIP archives or decompress files, clear the temporary files, or apply a filter to the tree view to narrow down items.
What's more, you can clear the user configuration, set the symbol path, launch a program and collect data during its runtime, abort any collection in progress, prepare files for analysis on another computer, take a heap snapshot (optionally from the dump), as well as compute the disk usage for a directory (recursively).
No error dialogs popped up in our testing, and the utility didn't hang or crash. It had a good response time and minimal impact on computer performance, running on low CPU and RAM. PerfView delivers a fast and simple method to examining ETW information and CLR memory data (heap dumps), and it can be seamlessly handled by anyone.
What's new in PerfView 3.1.9:
- Provide an option in PerfView to enable/disable truncation of the full raw event in the Events view when selecting “Dump raw event”.
- Fix the TraceEvent nuspec file to include all dependencies.
- Trim whitespace when parsing /Providers.
- Fix live session decoding of self-describing events.
PerfView 3.1.9
add to watchlist add to download basket send us an update REPORT- PRICE: Free
- runs on:
-
Windows 11
Windows 10 32/64 bit
Windows 8 32/64 bit
Windows 7 32/64 bit - file size:
- 21.4 MB
- filename:
- PerfView.exe
- main category:
- System
- developer:
- visit homepage
Windows Sandbox Launcher

Microsoft Teams

calibre

ShareX

Bitdefender Antivirus Free

4k Video Downloader

IrfanView

Context Menu Manager

Zoom Client

7-Zip

- Context Menu Manager
- Zoom Client
- 7-Zip
- Windows Sandbox Launcher
- Microsoft Teams
- calibre
- ShareX
- Bitdefender Antivirus Free
- 4k Video Downloader
- IrfanView