Improve the data visualization in Web and mobile apps by creating charts with sliding effects, using this JavaScript library set. #Chart Generator #JavaScript Library #Integrate Chart #Chart #Graph #Generate
KoolChart is a reliable JavaScript library, implemented using an HTML5 canvas. The tool offers you a comprehensive charting solution, allowing you to add numerous visualization features in your apps.
The component is created exclusively with JavaScript, on an HTML5 canvas, which is why it is platform independent.
The tool can be used any compatible browser, as well as with various non-browser World Wide Web solutions.
It is designed to render data, thanks to the animated sliding effects and allows you to adjust the chart parameters according to your preferences.
Not only can you design the chart structure, but you may also set colors, bar styles and animation time.
The charts thus created can be integrated with Web or mobile applications, even without Flash support or other plug-ins.
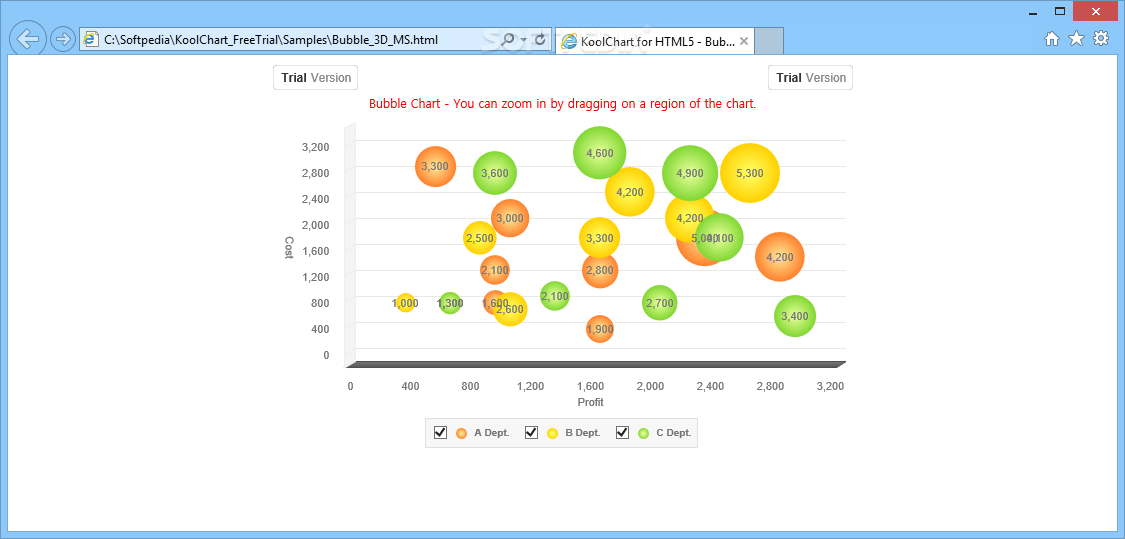
The tool can help you create various types of charts: 2D, 3D, bars, pies, doughnut, bubble, plot or target versus actual. Advanced chart types are also available for you to use: radar, history, real-til, broken axis, matrix or gauge.
The component is rather simple to use since it does not require installation. Simply extract the files from the archive and run the Index document with the browser of your choice.
The chart creation is based on XML, due to its permissive structure, for both designers and developers.
Aside from the multitude of chart types that you can choose from, KoolChart allows you to integrate the preferred theme into the project. You may change the layout of the chart with one mouse click.
The Data Editor allows you to view the actual information displayed in the chart, at any time, during the creation process.
The tool allows you also to replace colors with patterns, in order to make the charts more accessible to visually impaired users. Similarly, you can also replace data in the chart with text.
System requirements
- For the Client: HTML5 Canvas supported browsers
Limitations in the unregistered version
- 2 months trial
- Watermarks at the top corners of the charts
What's new in KoolChart 5.0:
- Data Interaction Feature:
- Now, using the interaction feature of KoolChart, you can provide users with notifications about the data that meets certain conditions in the chart data. CSS is used for formatting the notification such as the highlighting or flickering effect, a rolling text banner and an impressive image. Please check the details with our online demo
KoolChart 5.0
add to watchlist add to download basket send us an update REPORT- runs on:
- Windows All
- file size:
- 12.1 MB
- filename:
- KoolChart_FreeTrial.zip
- main category:
- Internet
- developer:
- visit homepage
4k Video Downloader

Bitdefender Antivirus Free

Microsoft Teams

IrfanView

Zoom Client

paint.net

calibre

Windows Sandbox Launcher

ShareX

7-Zip

- Windows Sandbox Launcher
- ShareX
- 7-Zip
- 4k Video Downloader
- Bitdefender Antivirus Free
- Microsoft Teams
- IrfanView
- Zoom Client
- paint.net
- calibre