Work with various statistics tools and graphical analysis methods, such as Analysis of Variance (ANOVA), Design of Experiments (DOE), as well as regression, time series and survival analysis. #Statistics processor #Statistical analysis #Statistical tool #Statistics #Analysis #Spreadsheet
StatPlus is an advanced statistical analysis program whose purpose is to help you perform from data transformation and sampling to complex non-parametric and regression analysis, survival analysis, as well as other functions.
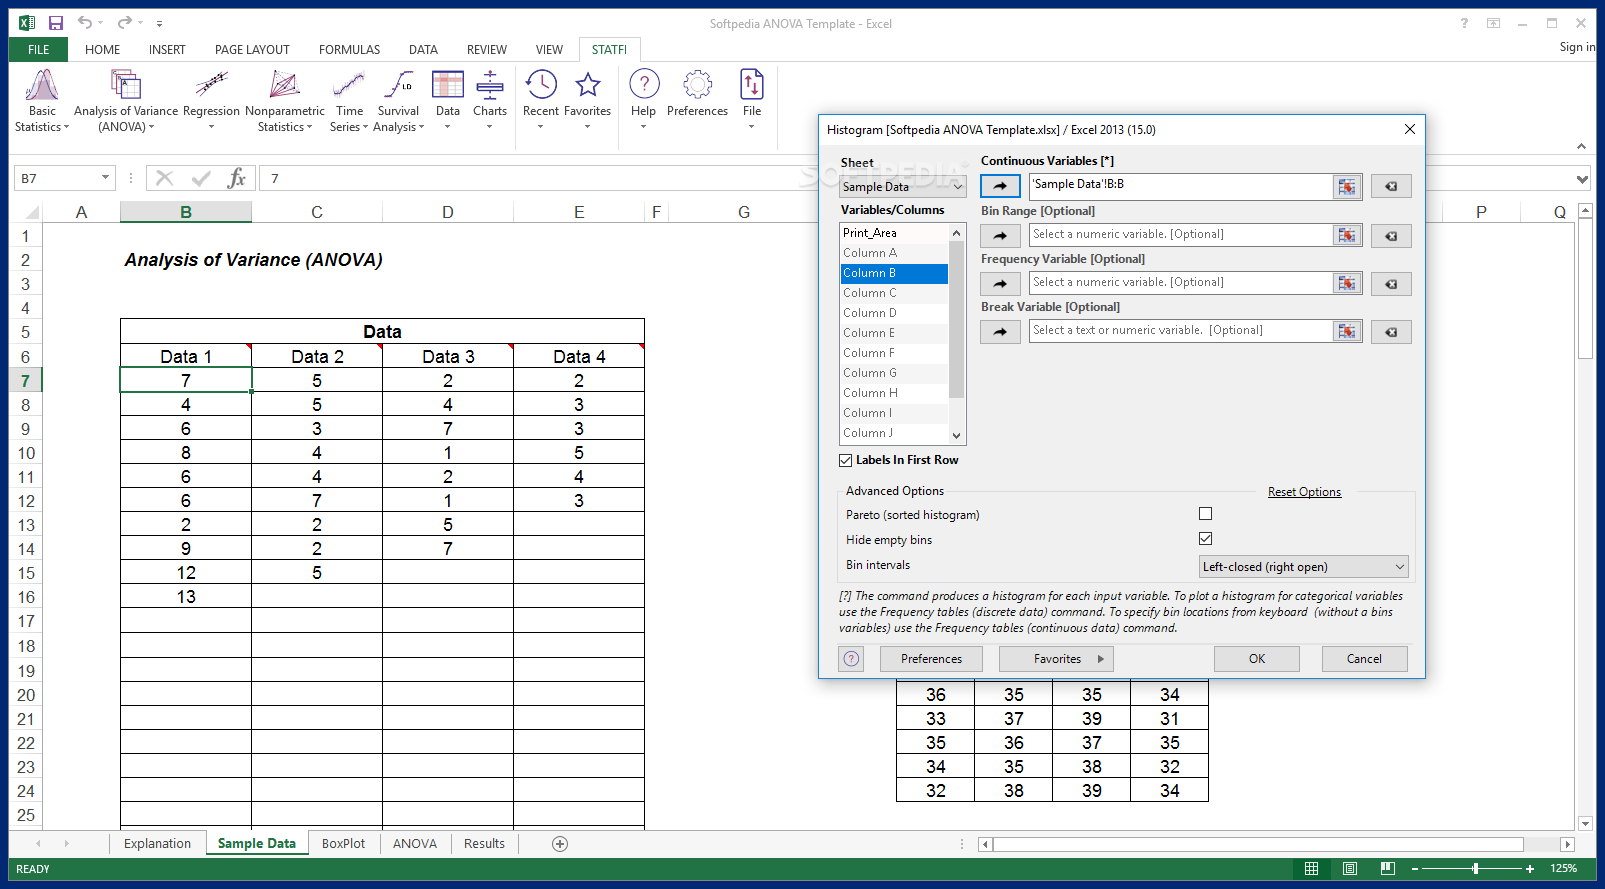
The app comes packed with a multitude of charts (histograms, bars, areas, point-graphs, pies, statistics, control charts) and worksheet math, statistical and financial functions. It also provides support for an Excel add-in that allows you to carry out statistical tasks directly from Excel’s interface.
StatPlus reveals a well-structured GUI where you can input data directly into a spreadsheet or import it from HTML, XLS, CSV, SAV, ODS, or other file formats. Thanks to the multi-tabbed layout, you can work with different tabs at the same time and quickly switch between them.
Editing features are implemented for helping you activate clipboard-related tasks (cut, copy, paste), delete entries, search for items, and undo or redo your actions. A spell checker is included in the package.
What’s more, you can insert cells, charts, symbols, functions, comments, pictures, and hyperlinks. Each cell can be customized in terms of layout (like horizontal or vertical alignment), color, font and border. You can print the information, send it via email or export it to the same file formats as the input ones.
StatPlus offers support for a wide range of statistical utilities so be prepared to spend some of your time discovering them. These tests are related to Comparing Means t-Tests, Pagurova Criterion, and G-Criterion, F-test, one and two-sample z-tests, correlation coefficients (Pearson, Fechner) and covariation, normality tests, cross tabulation, and frequency tables analysis (discrete/continuous).
What’s more, you can conduct tests related to Analysis of Variance (ANOVA) with one, two, three-way analysis of variance, data classification, Design of Experiments (DOE), as well as non-parametrics statistics, like 2x2 tables analysis (e.g. Chi-squared, Yates’ Chi-squared, Exact Fisher Test), rank correlations, and Cochran’s Q Test.
You can carry out regression analysis (e.g. logistic regression, polynomial regression), time series analysis (e.g. moving average, Fourier analysis, data processing), survival analysis (cox proportional-hazards regression and prohibit analysis), Power Analysis and Sample Size (PASS), and data processing (e.g. random number generation, matrix operations, sampling).
The tool lets you generate charts, such as Gantt, arrow, buble, error, pie, and controls charts like X-bar, R-chart, S-chart, P-chart, C-chart, U-chart, and CUSUM-chart. Charts can be printed or exported to BMP, GIF, JPEG, PDF, SVG, or other file formats.
StatPlus comes packed with a comprehensive package of statistics tools and graphical analysis methods, and is suitable especially for experienced users.
StatPlus 7.7.0.0
add to watchlist add to download basket send us an update REPORT- runs on:
-
Windows 11
Windows 10 32/64 bit
Windows 8 32/64 bit
Windows 7 32/64 bit - file size:
- 102 MB
- filename:
- statplus.exe
- main category:
- Office tools
- developer:
- visit homepage
Windows Sandbox Launcher

Microsoft Teams

Context Menu Manager

ShareX

IrfanView

7-Zip

calibre

Bitdefender Antivirus Free

Zoom Client

4k Video Downloader

- Bitdefender Antivirus Free
- Zoom Client
- 4k Video Downloader
- Windows Sandbox Launcher
- Microsoft Teams
- Context Menu Manager
- ShareX
- IrfanView
- 7-Zip
- calibre