Geology program that offers support for plate-tectonic reconstructions, geographic information system (GIS) and raster data visualization. #Tectonic plates movement #Tectonic plate analysis #Analize tectonic plate #Tectonic plate #Earthquake #Topography
GPlates is an open-source geology software application that provides an interactive visualization of plate-tectonic reconstructions through geological time. You can explore geological, geographic and tectonic data, as well as view vector/raster images. The tool can be run on Windows, Linux and Mac OS X.
The utility reveals a clean feature lineup but you still need to invest some extra time in order to digest its multitude of features. There’s support for an online help manual and tutorials that show you how to make the most out of the program’s capabilities.
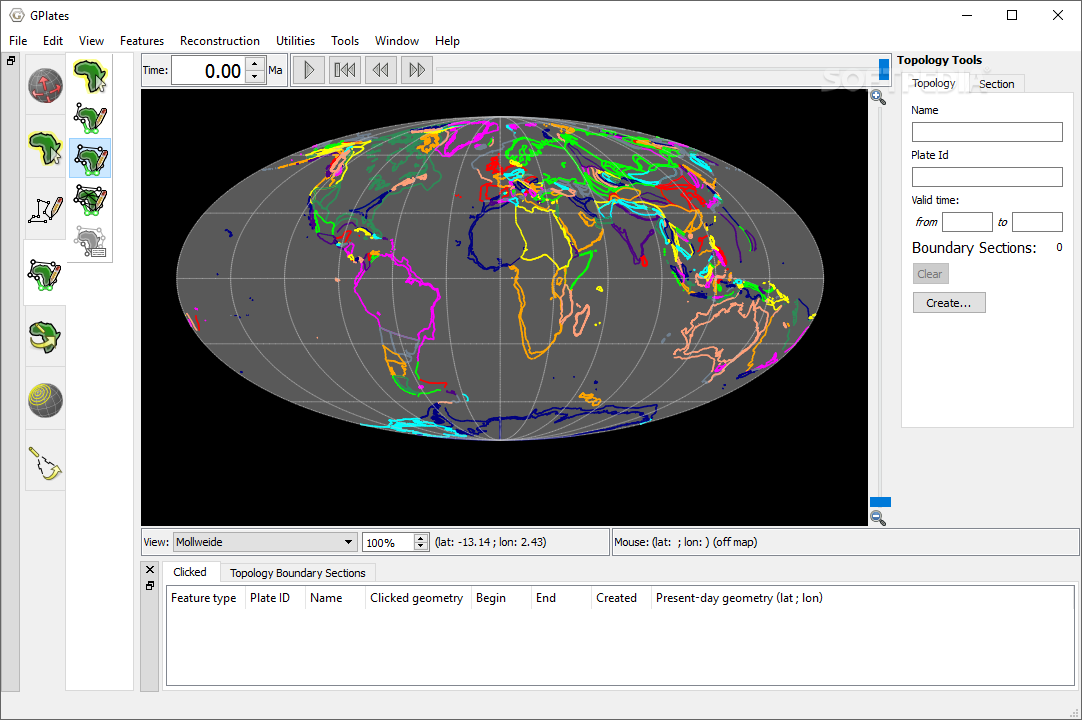
You can work with different view modes, namely 3D orthographic, rectangular, Mercator, Mollweide, and Robinson. You can zoom in or out of the projection, get the latitude and longitude coordinates, and make use of mouse movements for rotating the globe to different angles. A full screen mode is also on the feature list.
GPlates gives you the possibility to display data on a globe or map reconstructed to a moment in time. The app embeds several control buttons for helping you adjust the time, start or stop the animation, and go backward or forward in time.
You can measure the distance between two points, draw a vertex or point, move, insert, or remove a vertex, split the geometry of the selected element, modify reconstruction pole, build a new topology, edit topology sections, as well as create small circles.
Raster images can be imported from BMP, ERS, GIF, JPG, GRD, PNG, SVG, TIFF, BMP or other file format. You are allowed to create a virtual geomagnetic pole, generate velocity domain points, and load data from GPML, ESRI Shapefile or GMAP VGP files.
You can pick the data that you want to export, such as reconstructed geometries, image, velocities, resolved topologies, relative total rotation, and motion paths. Depending on the type of details that you want to export, the tool lets you make use of different file formats, such as NC, GRD, TIF, IMG, CSV, SHP, XY, and JPG.
GPlates comes packed with plate-tectonic reconstructions, geographic information system (GIS) and raster data visualization for helping you explore and manipulate data through time. The mix of advanced features stands as a guarantee that you will not get bored while working with this tool. It is suitable especially for professional users.
What's new in GPlates 2.0.0 Build 18164:
- PROJECTS AND RECENT SESSIONS:
- Now saves and restores all layer information:
- Including layer order, visibility and all settings within each layer (such as colour styles and colour palette filenames).
- Open projects using File menu, drag'n'drop, double-clicking or command-line.
GPlates 2.0.0 Build 18164
add to watchlist add to download basket send us an update REPORT- portable version
- GPlates Portable
- runs on:
-
Windows 10 32/64 bit
Windows 8 32/64 bit
Windows 7 32/64 bit - file size:
- 81.1 MB
- main category:
- Others
- developer:
- visit homepage
7-Zip

4k Video Downloader

Windows Sandbox Launcher

Microsoft Teams

Zoom Client

calibre

paint.net

Bitdefender Antivirus Free

ShareX

IrfanView

- Bitdefender Antivirus Free
- ShareX
- IrfanView
- 7-Zip
- 4k Video Downloader
- Windows Sandbox Launcher
- Microsoft Teams
- Zoom Client
- calibre
- paint.net