A sturdy and comprehensive debugging tool that allows you to thoroughly analyze the runtime breakpoints or various Windows executable. #Code debugger #Mode debugger #Analyze breakpoint #Code #Debugger #Process
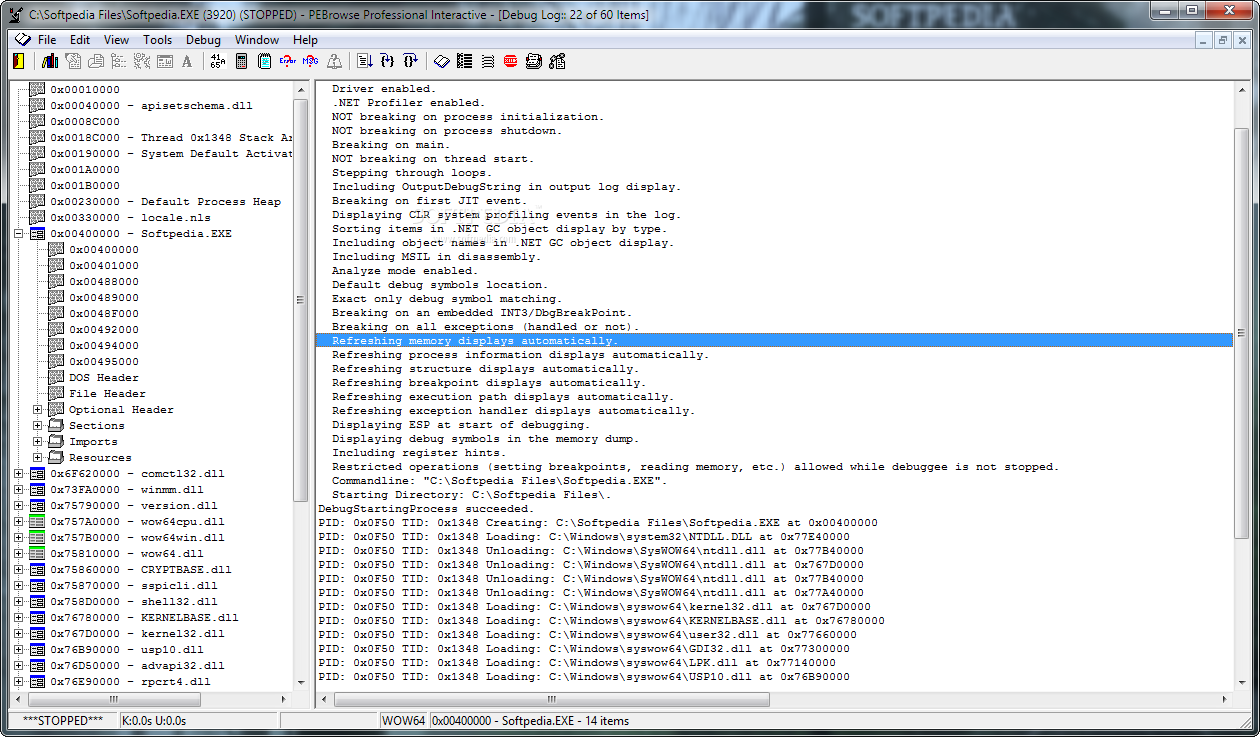
PEBrowse Profession Interactive is a very powerful, versatile, and customizable Win32 user mode debugger/disassembler.
PEBrowse Interactive is not a source code debugger, but operates at the Intel x86 instruction level and therefore at the lowest level where your program executes.
The debugger fully supports Microsoft .NET managed processes and seamlessly allows interop or mixed-mode debugging.
PEBrowse Professional Interactive can be used to disassemble EXE applications and recompose their breakpoints.
It can be set as the startup debugger using the system registry Image File Execution Options key - useful for debugging ASP.NET applications.
The color-coded disassembly displays also attempt to use symbolic information as well as offering various highlighting options designed to allow easy analysis of the code.
There is even convenient access to a scratchpad, a calculator, and tables for hex-to-ASCII values, common Win32 error codes, and Windows message codes.
There are many more options available on each window by accessing the context-sensitive menu items.
What's new in PEBrowse Professional Interactive 9.3.4:
- Added menuitem to display recursion counts in stackframe display.
- Added more kernel object type security information.
PEBrowse Professional Interactive 9.3.4
add to watchlist add to download basket send us an update REPORT- runs on:
-
Windows 2003
Windows 7
Windows Vista
Windows XP
Windows 2K - file size:
- 2 MB
- filename:
- PEBrowseDbgV9_3_4.zip
- main category:
- Programming
- developer:
- visit homepage
Microsoft Teams

Zoom Client

IrfanView

Context Menu Manager

7-Zip

ShareX

Windows Sandbox Launcher

4k Video Downloader

Bitdefender Antivirus Free

calibre

- 4k Video Downloader
- Bitdefender Antivirus Free
- calibre
- Microsoft Teams
- Zoom Client
- IrfanView
- Context Menu Manager
- 7-Zip
- ShareX
- Windows Sandbox Launcher