View all major debugging events that take place when an application is running, and find out exceptions, threads and processes created, DLLs loaded, and other information. #Program Debugger #Debug Program #Process Debugger #Debugger #Debug #Analysis
Most developers are aware that, regardless of their best efforts, the software they develop can include bugs that might result in decreased performance or even crashes of the application. This is why they need to perform thorough debugging before releasing their product to the public and this task can be achieved using dedicated third-party tools, such as SimpleProgramDebugger.
This utility does not require any installation onto the host computer as it can be run without any issues as soon as the contents of the downloaded package has been extracted to a user-defined location.
The graphic interface of SimpleProgramDebugger is intuitive and enables users to either attach it to a running process or start a new one with ease, depending on their necessities.
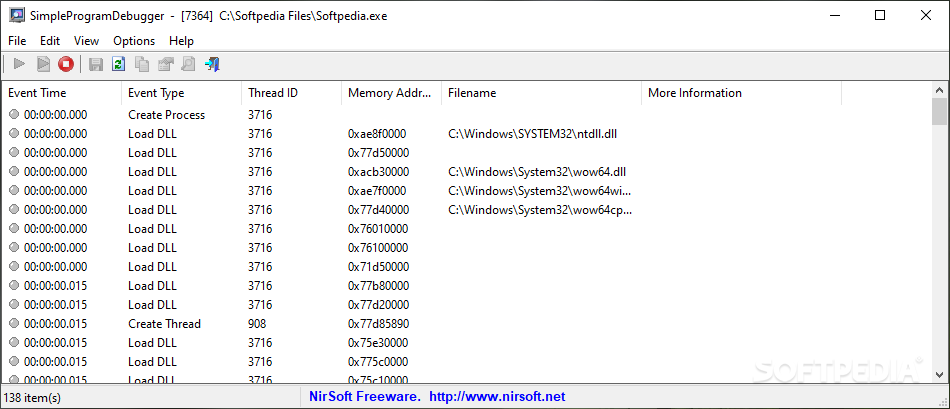
Once the chosen app file has started running, SimpleProgramDebugger also starts displaying a the debugging events associated to it, such as event time and type, thread IS, filename and memory address, along with further details when they were available.
In order to make all captured data is visible and that it can be easily interpreted, users can adjust the column sizes or disable some of the columns so as to ensure the app only displays the most relevant details. The grid lines can also be enabled or disabled, depending on users’ choices.
The generated report can then be exported to HTML, TXT, CSV or XML, thus allowing users to analyze them at a later time or to integrate them within other projects.
SimpleProgramDebugger is a reliable and useful software solution that comes in handy to all developers who want to run their apps in debugging mode so as to improve their performance and stability. Since SimpleProgramDebugger comes with a freeware license, one can give it a try without any strings attached.
What's new in SimpleProgramDebugger 1.16:
- Added 'Add Header Line To CSV/Tab-Delimited File' option (Turned on by default).
- Fixed a few high DPI mode issues.
- Fixed a bug that caused a small token handles leak (In the 'Select Process' window).
SimpleProgramDebugger 1.16
add to watchlist add to download basket send us an update REPORT- runs on:
-
Windows 11
Windows 10 32/64 bit
Windows 8 32/64 bit
Windows 7 32/64 bit
Windows Vista 32/64 bit
Windows XP 32/64 bit - file size:
- 60 KB
- filename:
- simpleprogramdebugger.zip
- main category:
- Programming
- developer:
- visit homepage
4k Video Downloader

Bitdefender Antivirus Free

Windows Sandbox Launcher

IrfanView

Zoom Client

calibre

ShareX

Microsoft Teams

7-Zip

Context Menu Manager

- Microsoft Teams
- 7-Zip
- Context Menu Manager
- 4k Video Downloader
- Bitdefender Antivirus Free
- Windows Sandbox Launcher
- IrfanView
- Zoom Client
- calibre
- ShareX