A tool for the spatial analysis of diversity. #Spatial analysis #Diversity analysis #Diversity analyzer #Spatial #Diversity #Analyzer
Biodiverse is a tool for the spatial analysis of diversity using indices based on taxonomic, phylogenetic and matrix-based (e.g. genetic distance) relationships, as well as related environmental and temporal variations.
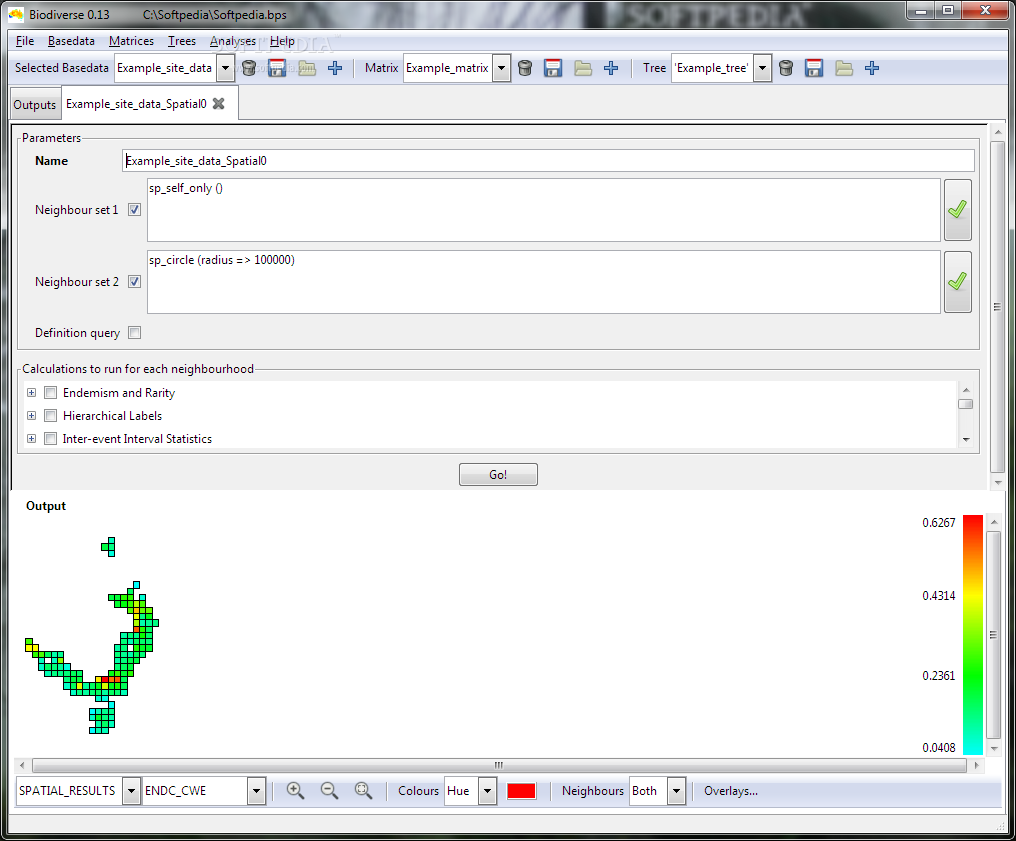
Biodiverse supports four processes: 1. linked visualisation of data distributions in geographic, taxonomic, phylogenetic and matrix spaces; 2. spatial moving window analyses including richness, endemism, phylogenetic diversity and beta diversity; 3. spatially constrained agglomerative cluster analyses; and 4. randomisations for hypothesis testing.
Take Biodiverse for a test drive to see what it can actually do for you!
What's new in Biodiverse 0.16 Beta:
- General:
- Groups and spatial outputs can now be exported direct to DIVAGIS raster formats. Issue #220
- GUI:
Biodiverse 0.16 Beta / 0.15
add to watchlist add to download basket send us an update REPORT- runs on:
- Windows All
- file size:
- 37.9 MB
- filename:
- BiodiverseGUI_0.16beta_20111109.exe
5 screenshots:
- main category:
- Science / CAD
- developer:
- visit homepage
Microsoft Teams
Effortlessly chat, collaborate on projects, and transfer files within a business-like environment by employing this Microsoft-vetted application

Bitdefender Antivirus Free
Feather-light and free antivirus solution from renowned developer that keeps the PC protected at all times from malware without requiring user configuration

paint.net
Packed with an array of options and an intuitive interface, this application enables you to create professional-looking photographs

IrfanView
With support for a long list of plugins, this minimalistic utility helps you view images, as well as edit and convert them using a built-in batch mode

ShareX
Capture your screen, create GIFs, and record videos through this versatile solution that includes various other amenities: an OCR scanner, image uploader, URL shortener, and much more

4k Video Downloader
Export your favorite YouTube videos and playlists with this intuitive, lightweight program, built to facilitate downloading clips from the popular website

calibre
Effortlessly keep your e-book library thoroughly organized with the help of the numerous features offered by this efficient and capable manager

7-Zip
An intuitive application with a very good compression ratio that can help you not only create and extract archives, but also test them for errors

Zoom Client
The official desktop client for Zoom, the popular video conferencing and collaboration tool used by millions of people worldwide

Windows Sandbox Launcher
Set up the Windows Sandbox parameters to your specific requirements, with this dedicated launcher that features advanced parametrization

% discount
7-Zip
- 7-Zip
- Zoom Client
- Windows Sandbox Launcher
- Microsoft Teams
- Bitdefender Antivirus Free
- paint.net
- IrfanView
- ShareX
- 4k Video Downloader
- calibre
essentials
User Comments
This enables Disqus, Inc. to process some of your data. Disqus privacy policy