Try a free, NASA-designed application that allows plotting raster images of geo-gridded data and different types of array-structured datasets, such as netCDF, HDF, or GRIB. #Plot Raster Image #Geo Referenced Array #NetCDF Reader #Geo #Refference #Map
Panoply is a powerful utility that enables easy data visualization and analysis on multi-dimensional maps and grids.
From a technical point of view, this tool is a cross-platform utility that is compatible with Windows OS, macOS, Linux, and other, less-commercially-known devices and operating systems.
The tool is pretty small in size, can easily be initialized from your device, and offers great accessibility. You don't need to go through an installation process and can directly access it from its executable. As such, it can be stored (and moved) onto USB flash drives or other portable devices.
One of the most important requirements for running Panoply is getting your system ready and up to date with a newer version of your Java SE. Being a Java-based tool, you must have Java 9, or a later version, installed on your computer.
With this application, you can manage and analyze 1D/2D images and maps, complex datasets composed of multiple visual instances. The tool supports importing data packages in formats such as NetCDF, HDF, GEMPACK, GRIB, GEMPACK, and other color tables (including Adobe color tables).
Using this application is an easy and quite intuitive process. You can download and open some sample data packages from NASA's website for testing Panoply's functionalities and options. On the flip side, if you already are experienced with these kinds of programs, just open your files and start working.
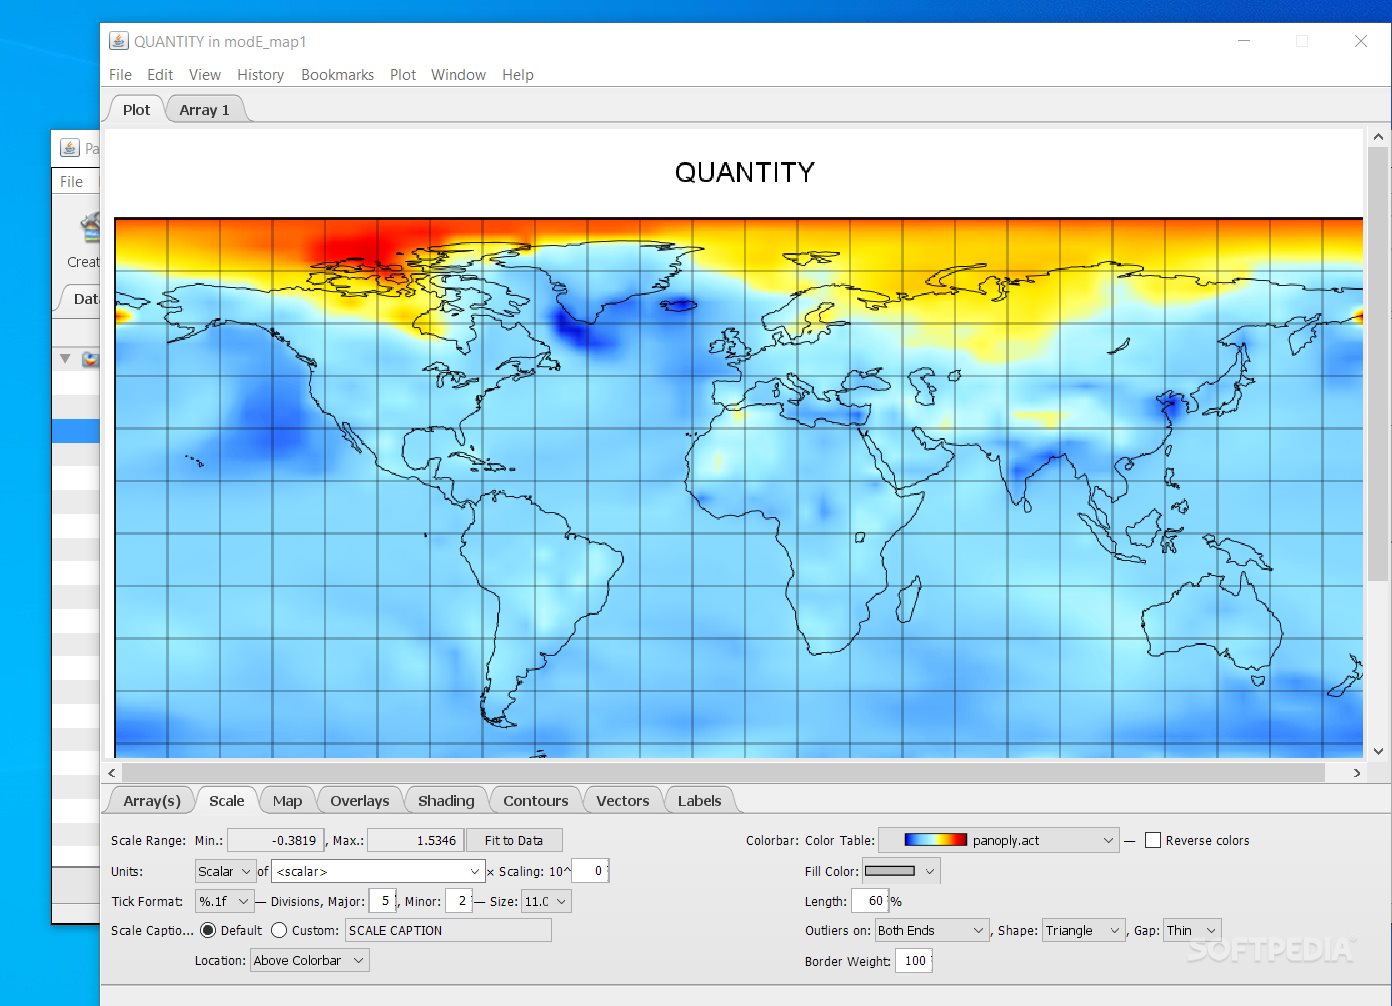
Panoply allows running different layers and opening different instances of graphs. Once your load a file, all of its components are going to be arranged in a structured manner. You can generate different types of plots from each and every one of these files, and open (in distinct windows) multiple geo-gridded, 2D, or simple-line plots.
In every new window, you can configure the array(s)'s interpolation, the data scaling and displaying options, change the color tables, the grids' colors, length, and border weight, choose the overlays' style and weight, adapt any existing shading or contours, adjust vectors, and redesign default labeling.
All things considered, Panoply is amazingly flexible, intuitive, and suitable for beginners and experienced users as well. The tool combines accessibility with complexity.
As such, you can rapidly import and export data, comparatively analyze datasets and arrays, enhance certain image/map areas for targeting important aspects, save your plots to various formats (GIF, JPEG, PNG, TIFF, PDF, or PostScript), or slice and plot 1D or 2D data from larger multidimensional variables.
What's new in Panoply 5.3.4:
- Open and save filechoosers retain more state info between uses during session.
- Watch out for units strings that use a double asterisk to represent a following exponent.
- Bugfix: Small default buffer caused a lot of overhead downloading remote datasets.
- Library: Updated netCDF-Java to v. 5.5.4 (snapshot 3/27).
Panoply 5.3.4
add to watchlist add to download basket send us an update REPORT- PRICE: Free
- runs on:
-
Windows 11
Windows Server 2019
Windows Server 2016
Windows 10 64 bit
Windows Server 2012 R2
Windows Server 2012
Windows 8 64 bit
Windows 7 64 bit - file size:
- 42 MB
- filename:
- PanoplyWin-5.3.4.zip
- main category:
- Science / CAD
- developer:
- visit homepage
Windows Sandbox Launcher

Context Menu Manager

4k Video Downloader

IrfanView

Microsoft Teams

Zoom Client

7-Zip

calibre

ShareX

Bitdefender Antivirus Free

- calibre
- ShareX
- Bitdefender Antivirus Free
- Windows Sandbox Launcher
- Context Menu Manager
- 4k Video Downloader
- IrfanView
- Microsoft Teams
- Zoom Client
- 7-Zip