Plot graphs and run scripts using this data analysis application designed to generate graphical representations of numerical datasheets. #Data Graph #Plot Data #Generate Graph #Graph #Plot #Plotter
Computers are not only used to get online, watch movies and play video games. Thanks to their high computing speed, math expressions are solved faster than you can blink. Although Windows is equipped with a calculator, functionality only stretches so far and you need more advanced methods for complex equations. In this regard, SigmaGraph comes as a means of piling up various data in order to get ahold of its graphical representation.
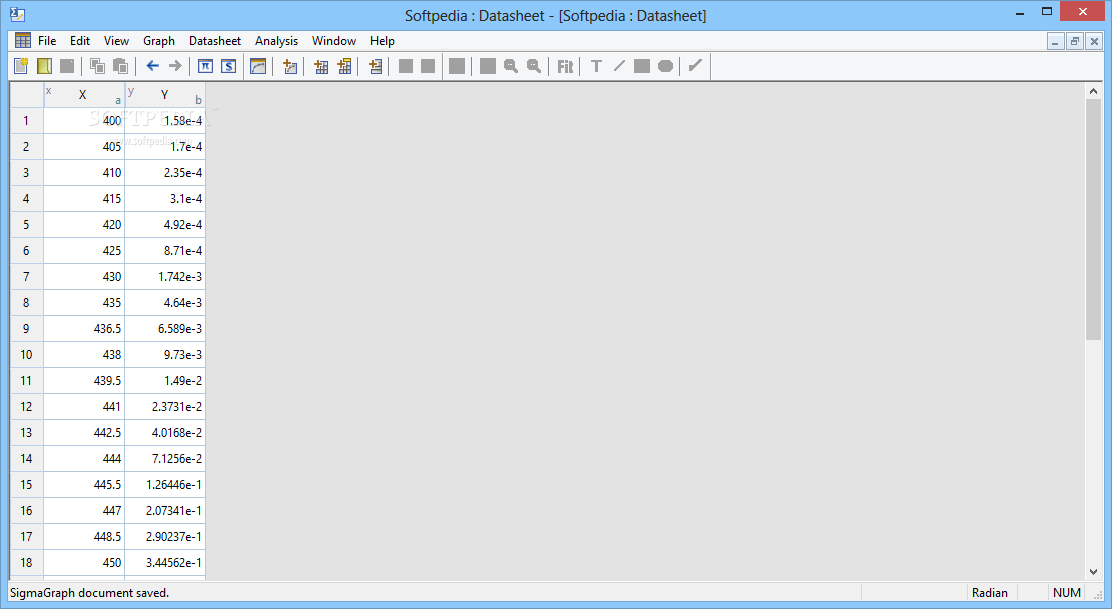
Math is a complicated enough subject so the application tries to keep all aspects simple, starting with its interface. A small toolbar holds all controls you need in order to manage tables and graph parameters, while the rest of the space lets you arrange windows as you see fit.
Adding files is easily done either through the dedicated file explorer or by dragging them over the main window. As long as data is properly written in a file, you can import SID, TXT, DAT, CSV and LUA files. The application lets you specify a few details before data is displayed, such as delimiter type, whether or not to skip a certain number of rows, and read titles if available.
However, you can start and create your table of values from scratch, without adding any external data. An abundance of math operations can be performed by bringing up a console window. Values go into fields you specify and enthusiasts can also import or write down scripts for more complex operations.
When you build the graph, you might consider something went wrong along the way. This is because you need to define what the application draws by selecting columns and functions through which they interact. Drawing tools and the possibility to add text allow you to add more info in case something needs to be mentioned.
Taking everything into consideration, we can say that SigmaGraph is a straightforward application that gives you the possibility to quickly generate a graph from a set of values, or create tables and define custom operations to experiment with complex expressions. Both beginners and experienced users can take advantage of its features thanks to the clever design. For research, quick calculus and plotting it's definitely worth a try.
What's new in SigmaGraph 2.6.9:
- Multi-peak fitting updated; New 'Auto Export' option, to automatically save data in text file and plot in SVG format; Bug fixes.
SigmaGraph 2.6.9
add to watchlist add to download basket send us an update REPORT- portable version
- This is the portable version of the application. An installable version is also available: SigmaGraph Portable
- runs on:
-
Windows 10 32/64 bit
Windows 2008
Windows 2003
Windows 8 32/64 bit
Windows 7 32/64 bit
Windows Vista 32/64 bit
Windows XP - file size:
- 9.9 MB
- filename:
- sigmagraph_setup_windows.msi
- main category:
- Science / CAD
- developer:
- visit homepage
7-Zip

Windows Sandbox Launcher

Zoom Client

Bitdefender Antivirus Free

IrfanView

4k Video Downloader

ShareX

calibre

Microsoft Teams

paint.net

- calibre
- Microsoft Teams
- paint.net
- 7-Zip
- Windows Sandbox Launcher
- Zoom Client
- Bitdefender Antivirus Free
- IrfanView
- 4k Video Downloader
- ShareX