A handy and intuitive Excel application that allows you to plot the impedance, frequency and magnitude of several electronic devices. #Impedance plot #Smith chart plot #Transmission line #Smith chart #Plot #SWR
Working with electronic devices means a lot of precise calculations and measurement, as an error can make your whole device short circuit and malfunction. That is why it is important to thoroughly analyze the characteristics and properties of each device before using it.
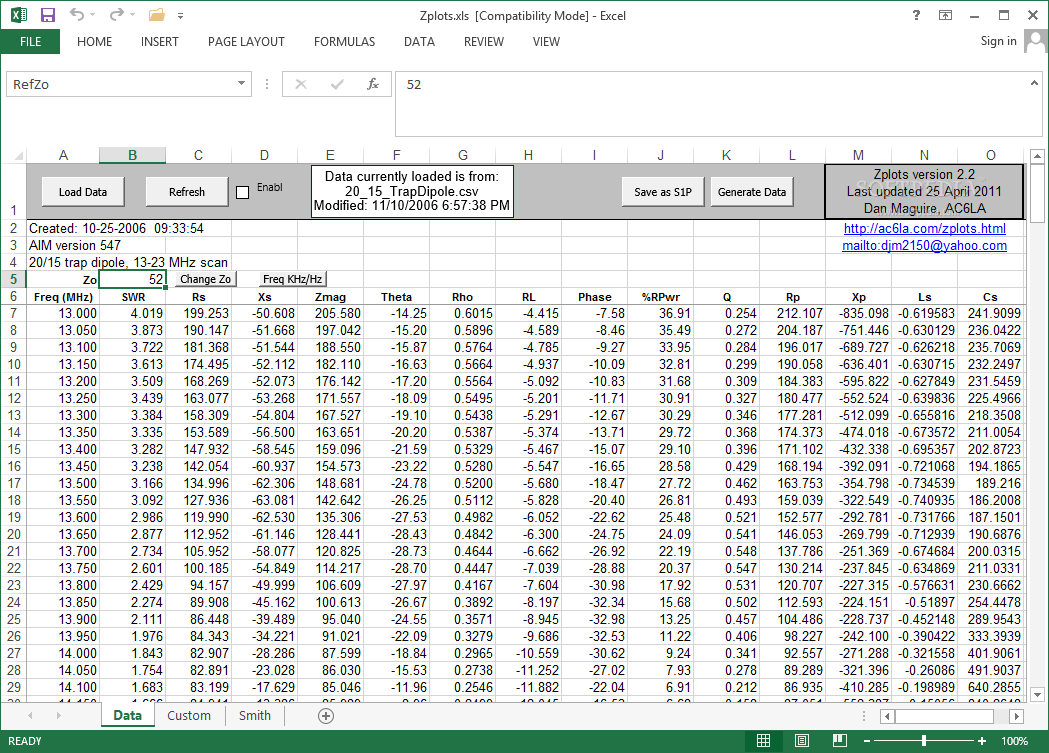
An application that can help you perform advanced analysis of impedance, along with other related data is Zplots. It works as an Excel spreadsheets, meaning that you need to have Microsoft Office Excel in order to use it.
The program helps you compute various mathematical values related to electronic devices, such as Standing Wave Ratio(SWR), resistance(Rs), reactance(Xs), impedance magnitude(Zmag), impedance angle(Theta), reflection coefficient magnitude(Rho), return loss(RL), reflection coefficient angle(Phase), reflected power, quality factor(Q, |Xs| / Rs), resistance(Rp), reactance(Xp) and equivalent inductance for series and parallels Xs(Ls (µH)), Xs(Cs (pF)), Xp(Lp (µH)) and Xp(Cp (pF)).
By computing all these values, you are able to properly calibrate any device, so that it functions within optimal parameters.
With the help of Zplots, you can generate graphs for each parameter characteristic to an electronic device, such as frequency or impedance. By doing so, you can compare the values you entered with the optimal ones, so that you can correctly use the machine.
Aside from that, you have the possibility to choose the graph generated, depending on your necessities or preferences. Choosing whether you use a grid or round graph can help you faster understand the properties of your plot.
To conclude, Zplots provides you with a stable environment for generating detailed graphs and plots, in order to analyze the properties of certain electronic devices.
What's new in Zplots 2.5:
- In regions where a comma is used as the decimal point, the "Frequency - Velocity Factor - Length - Wavelength Conversions" dialog would fail or would show incorrect results.
Zplots 2.5
add to watchlist add to download basket send us an update REPORT- runs on:
- Windows All
- file size:
- 683 KB
- filename:
- Zplots.zip
- main category:
- Science / CAD
- developer:
- visit homepage
Context Menu Manager

Microsoft Teams

7-Zip

Windows Sandbox Launcher

4k Video Downloader

Bitdefender Antivirus Free

IrfanView

calibre

ShareX

Zoom Client

- calibre
- ShareX
- Zoom Client
- Context Menu Manager
- Microsoft Teams
- 7-Zip
- Windows Sandbox Launcher
- 4k Video Downloader
- Bitdefender Antivirus Free
- IrfanView