Monitor system performance and stay up to date with your PC's behavior using this application that won't intrude upon your workflow. #Performance monitor #CPU utilisation #Memory usage #Performance #Monitor #CPU
FreeMeter is a program developed to monitor system performance and provide plenty of details regarding both the CPU and memory.
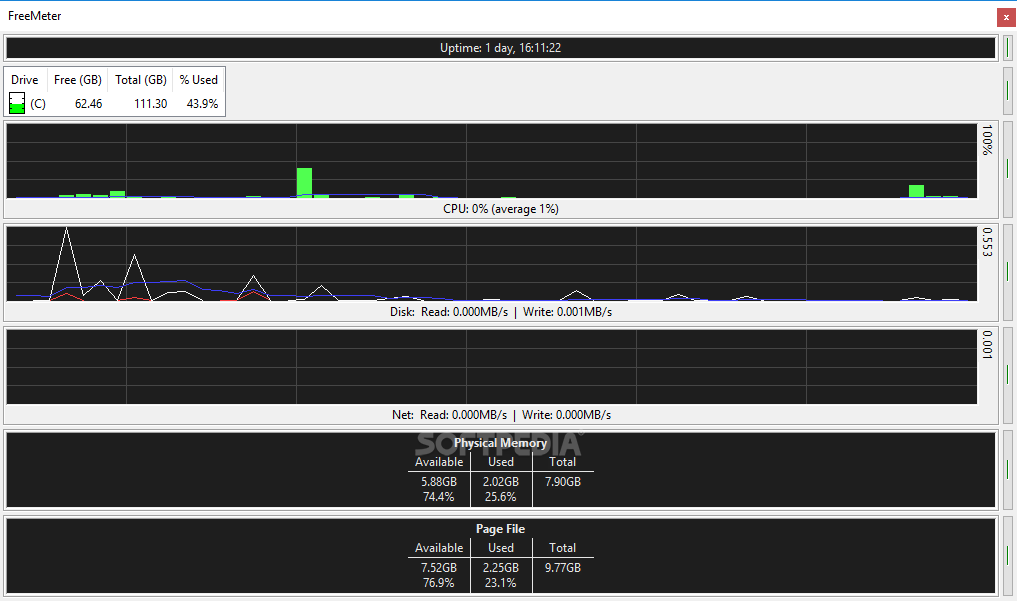
With a professional-looking GUI, FreeMeter groups the essential data right in a single screen, showing not only free space on the local drives, but also CPU and disk usage.
The dedicated panel aimed at local drives displays free, used and total space, while the two available graphs present CPU and disk activity. There are special panels to displays physical memory and page file information, again with stats concerning the available, used and total data.
The configuration screen is the one that requires much more attention because it groups tons of options concerning not only the built-in features, but also the way the app looks.
You can for example set transparency, configure meters and alerts, but also change update times and other application options.
FreeMeter also places an icon in the Windows System Tray to show real-time stats, regardless if we’re talking about CPU and memory usage, file server traffic or disk transfer rates.
FreeMeter works smoothly on all Windows versions and doesn’t even require administrator privileges on Windows 7 workstations.
To sum up, this is undoubtedly a handy product, although we all agree that a bit more user-friendly approach could come in very handy. While it’s a good thing that it comes with so many configuration options, they must be displayed in a better organized layout, thus making everything easier for both rookies and those more experienced.
What's new in FreeMeter 2.11.0.179:
- New Windows 8/10 style system tray icons
- Optional flat meter drawing style
- Professional version only:
- CPU meter shows user and kernel CPU use
FreeMeter 2.11.0.179
add to watchlist add to download basket send us an update REPORT- runs on:
- Windows All
- file size:
- 2.6 MB
- filename:
- FreeMeterSetup_v2.11.0.exe
- main category:
- System
- developer:
- visit homepage
4k Video Downloader

Microsoft Teams

Windows Sandbox Launcher

ShareX

7-Zip

Zoom Client

calibre

Bitdefender Antivirus Free

Context Menu Manager

IrfanView

- Bitdefender Antivirus Free
- Context Menu Manager
- IrfanView
- 4k Video Downloader
- Microsoft Teams
- Windows Sandbox Launcher
- ShareX
- 7-Zip
- Zoom Client
- calibre