14 DAY TRIAL //
 I am a person who uses very much the Internet and sometimes I am be curious about some aspects of this big domain, especially what is happening to my computer when it is connected to Internet. And because I'm curious, I must have the ways to investigate and monitor my network connection (heh, maybe because once I was a network administrator). I choose Iptraf, a great tool for monitoring a network connection.
I'm not trying to offer an expert's opinion in these lines. I just want to show other people a great application which is very easy to use and quite useful.
Iptraf is a console-based application which runs on Linux and other UNIX-like systems. It gathers a variety of figures such as TCP connection packet and byte counts, interface statistics and activity indicators, TCP/UDP traffic breakdowns, and LAN station packet and byte counts.
Now let's see why it is so attractive and what its features are. I must say that Iptraf is an application that can be run only as root (administrator account on Unix systems). It has an ncurses interface, which is a good-looking improvement over the traditional text interfaces. That's why Iptraf is easy to use and you don't have to write long text commands, somewhat specific to Unix systems.
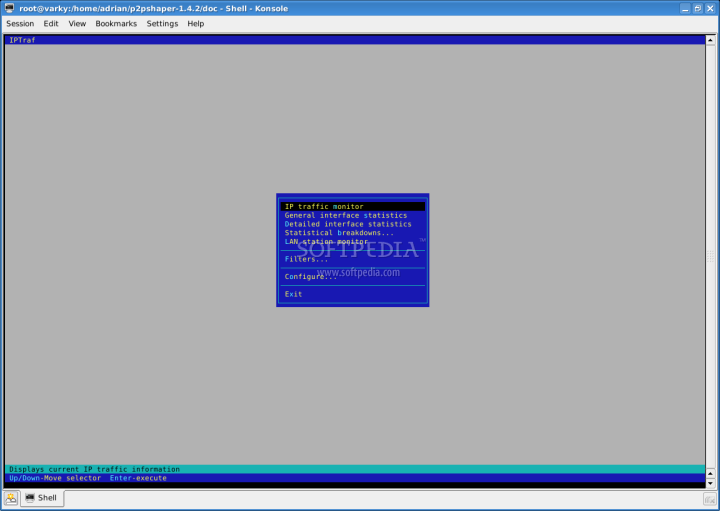
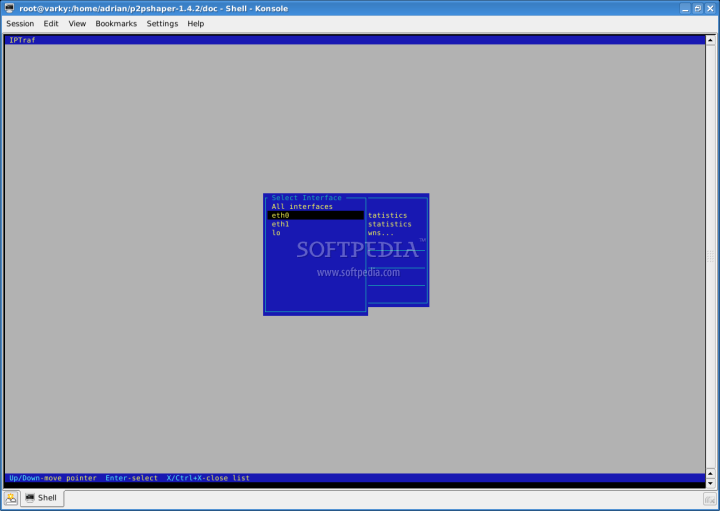
Let's type the "iptraf" command in a console. We will see a blue window and a message which tells us to press any key to continue, to enter to main menu. In the application menu we can navigate with the help of directional keys, up, down, left, right. The menu options are: IP traffic monitor, General interface statistics, Detailed interface statistics, Statistical Breakdowns, LAN station monitor, Filters, Configuration and Exit.
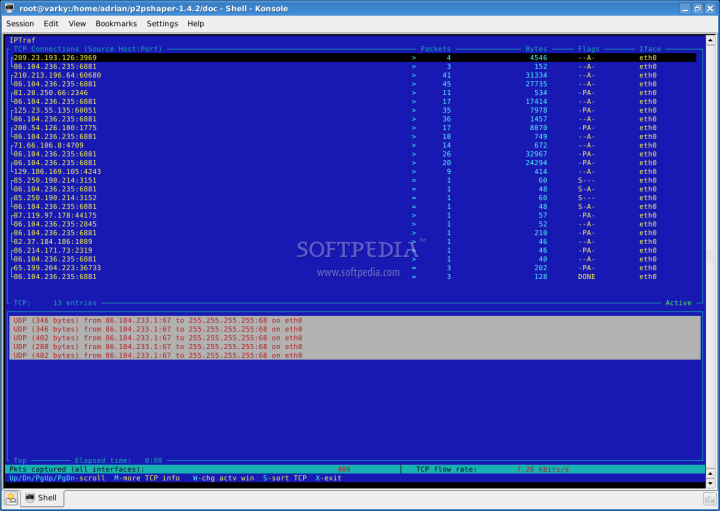
The first menu, IP traffic monitor, is very useful to watch for the IP addresses your computer is connected to (or what computers are connected to you). Many of us have more that one network card in computer and with Iptraf we can monitor the interfaces separately or together. You can also see what TCP ports are used for the connections, on the local endpoint and at the remote computers. Another important aspect is that you can see the speed of connection for every connection.
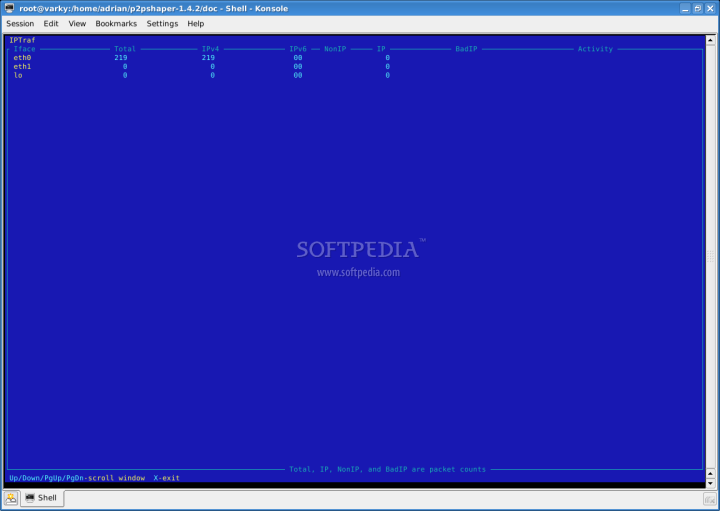
The second menu is General interface statistics and it shows you the speed of your connection if you are downloading from the Internet. Again, it can show all the network interfaces and the traffic which flows through them.
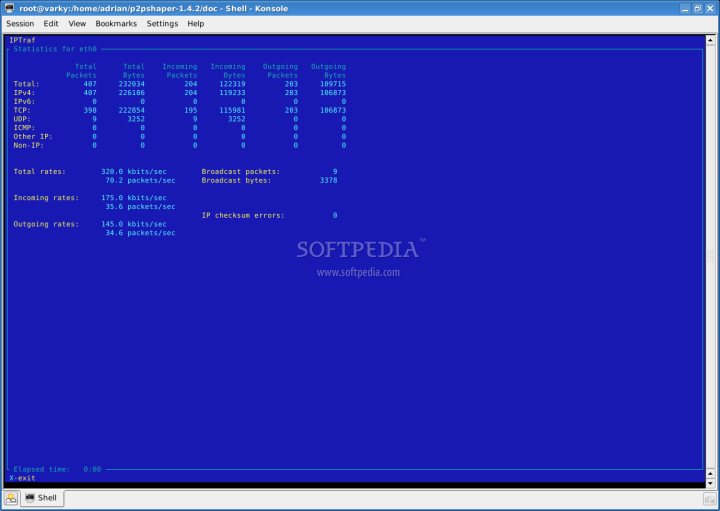
Detailed interface statistics has the ability to show only separate statistics for every network interface. We can see here the total rate of traffic through one interface, incoming rate (the inbound traffic and speed, the data which is downloaded by us), outgoing rate (traffic which is uploaded from us). There is detailed information about the nature of incoming and outgoing packets, but this is not so important for a normal user to know.
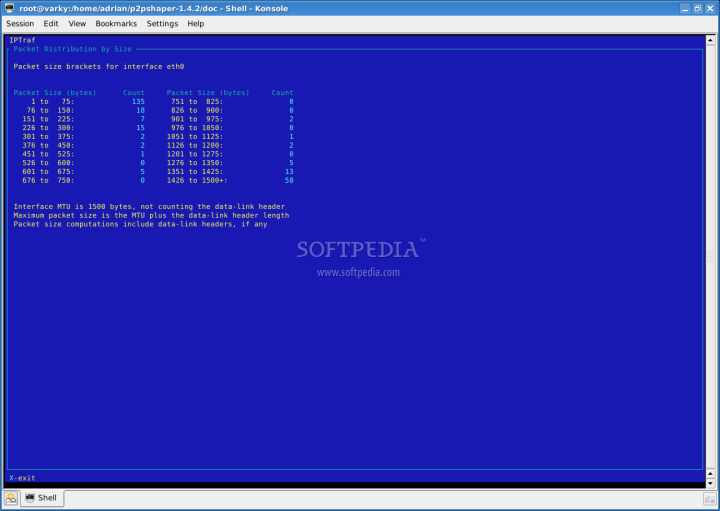
The Statistical breakdown takes the interface's Maximum Transmission Unit (MTU) size and divides it into 20 brackets, each bracket containing a range of sizes. As a packet is captured, its size is determined and the appropriate bracket is incremented. This facility provides an idea as to the packet sizes passing over your network, and can aid in network (re)design decisions. This information will be of interest to you only if you are a network administrator.
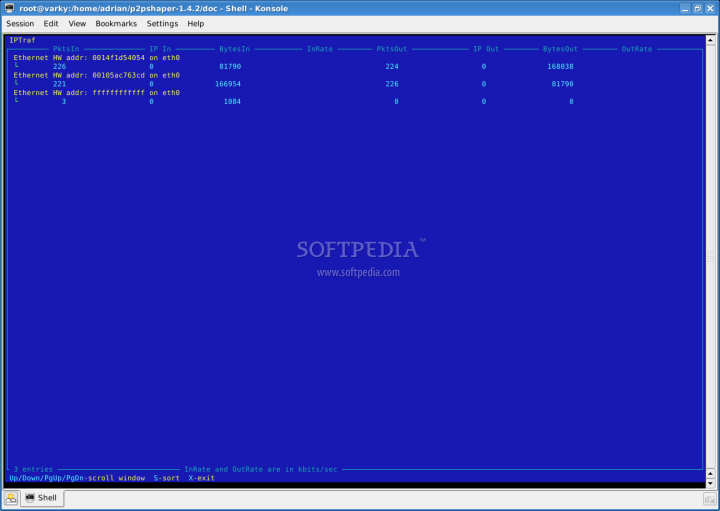
The LAN station monitor is another facility that can be useful for the specialists, but it is very helpful for normal users as well. The aforementioned facility discovers MAC addresses and displays statistics on the number of incoming, and outgoing packets. It also includes figures for incoming and outgoing kilobits per second for each discovered station. The entry above each line of statistics is the station's LAN type (Ethernet, PLIP, Token Ring, or FDDI) and the hardware MAC address. Each statistics line consists of the following information: total packets incoming, IP packets incoming, total bytes incoming, incoming rate, total packets outgoing, IP packets outgoing, total bytes outgoing and outgoing rate. This facility works only for Ethernet, PLIP, Token Ring, and FDDI frames. Loopback, ISDN, and SLIP/PPP networks are not monitored here.
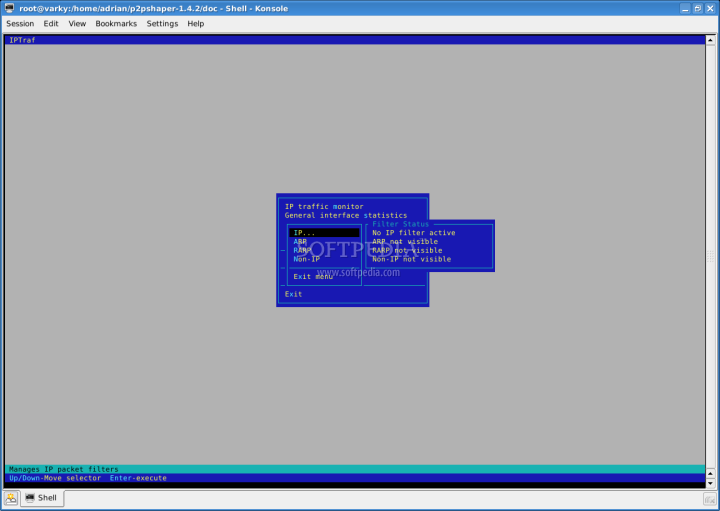
Filters are used to control the information displayed by the IP traffic monitor, general and detailed interface statistics, and TCP/UDP statistical breakdown. If you want to view statistics for a particular type of traffic, you must restrict the information displayed with filters (they also apply to logging activity).
This is what I had to say about Iptraf. I hope that the information provided was easy to understand and can be assimilated if you will also browse through the Iptraf documentation a little.
The good
Iptraf proves to be an application which is addressed to normal users and security and network specialists, too.
The bad
I think that a normal user should see what is happening with the Internet connection, not only the administrator (if possible).
The truth
Iptraf is a strong network utility which offers many features, is user friendly and is very well documented.
Here are some snapshots of the application in action: