14 DAY TRIAL //
 I'm sure you all are familiar with the KOffice suite for the K Desktop Environment. Primarily designed for the Unix operating systems, KOffice uses by the default the OpenDocument format and includes: KWord, a word processor with style sheets and frame-support for DTP-style editing of complex layouts, KSpread, a spreadsheet application, KPresenter, a presentation program, Kivio, Karbon12 vector drawing application, Krita, Kugar, KFormula, Kexi, KPlato and KChart report and chart generator.
Today I will tell you about Kchart. As the name suggests, it can be used for drawing diagrams using some given data or the data from the KSpread cells. Almost all aspects of a chart are customizable, including the legend, footers, headers, chart title, font, color, and background. KChart comes with two major advantages: one would be the much improved, modern default formatting and the second would be the charts' size, which can be significantly expanded. You can use it also to embed charts into your KOffice documents. Despite the penurious look, this little application might exceed your expectations through its ease-of-use and high power of configuration. The provided chart types are not many, but they cover very well the most used prototypes. You could be impressed by its layout flexibility; for example, the legends do not have a fixed position on the chart, they can be placed in the center, or at an edge or up/down in one of the four corners. However, the default configuration is not bad at all. The default values for all the parameters are relative to the window size. A bad aspect in KChart and actually in more KOffice applications, would be the fact that it moves really slow.
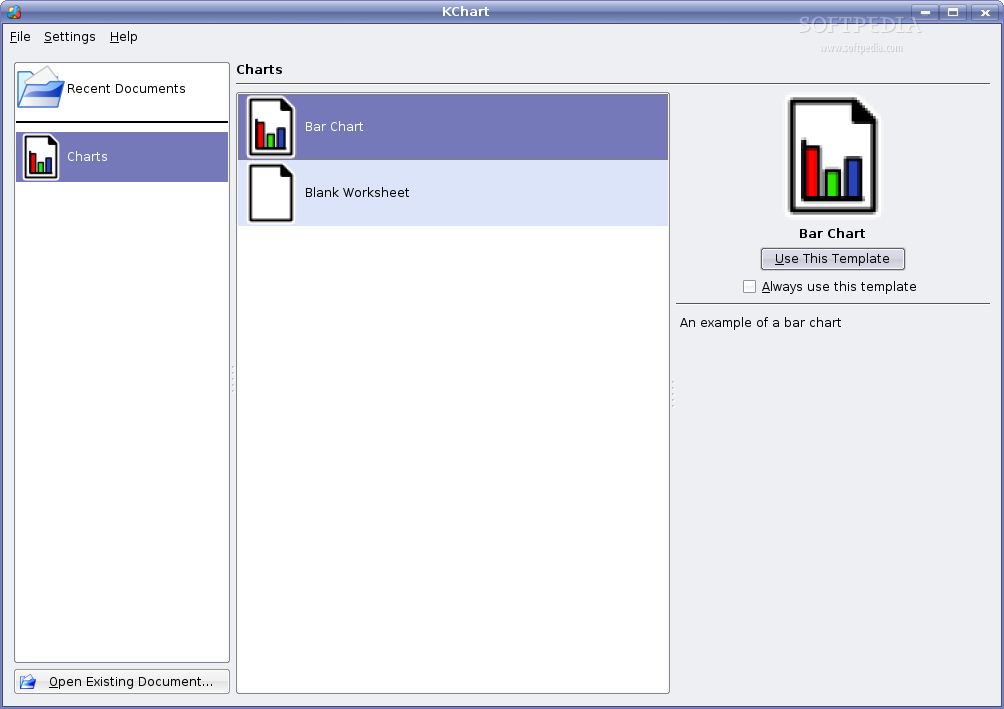
As I was saying earlier, the user's interface looks quite poor and has nothing to impress one. Even from the start-up you can make an idea of it. The application opens with a welcoming dialog and there you can choose between two templates or open a recent chart document. I usually need the default template, the Bar Chart, to be more specific. If you choose it, you will notice it has already some example data filled in by default.
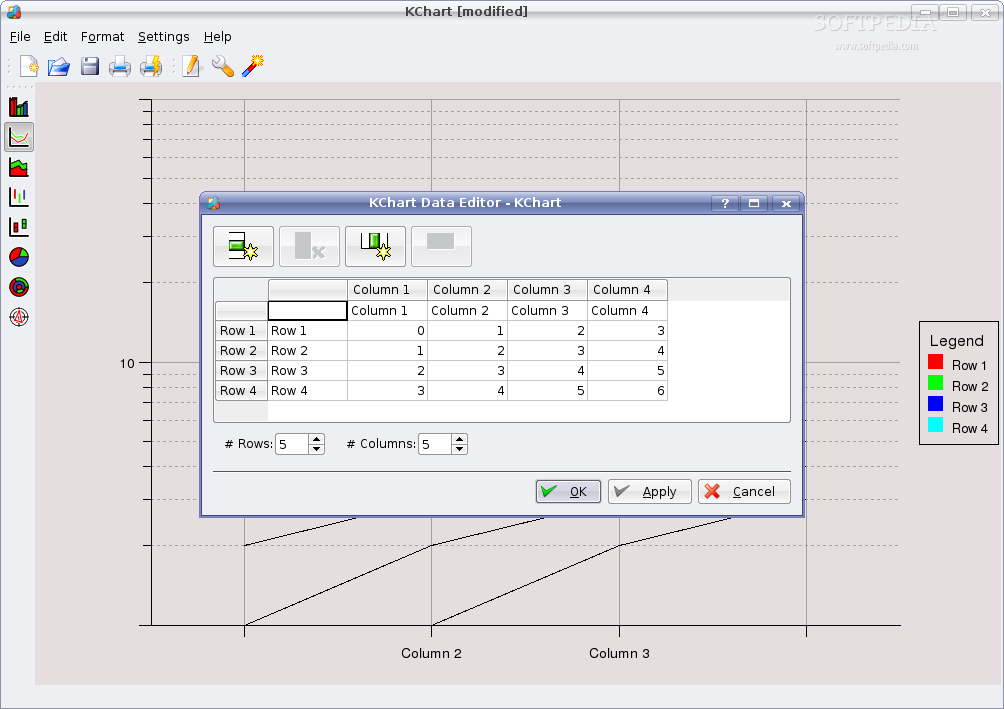
One of the tools I found useful at this application is the Chart Wizard. In a few steps one can easily and quickly set up options such as chart type or labelling. Another indispensable tool would be the Data Editor, used when the application runs as standalone. It can be started by following the Edit -> Edit Data path or by clicking on the Edit data button on the toolbar. In the Data Editor you'll define the number of rows and columns and you'll also set all the values you need. Here you can change the names for columns and rows, by clicking on them. However, in the case of data entry I have noticed that you can switch between cells by using tab, but when it goes to the next cell it does not highlight the current default value so you can overwrite it. Thus, you'll have to be careful and delete that value by yourself, otherwise you won't get the expected result due to incorrect input data.
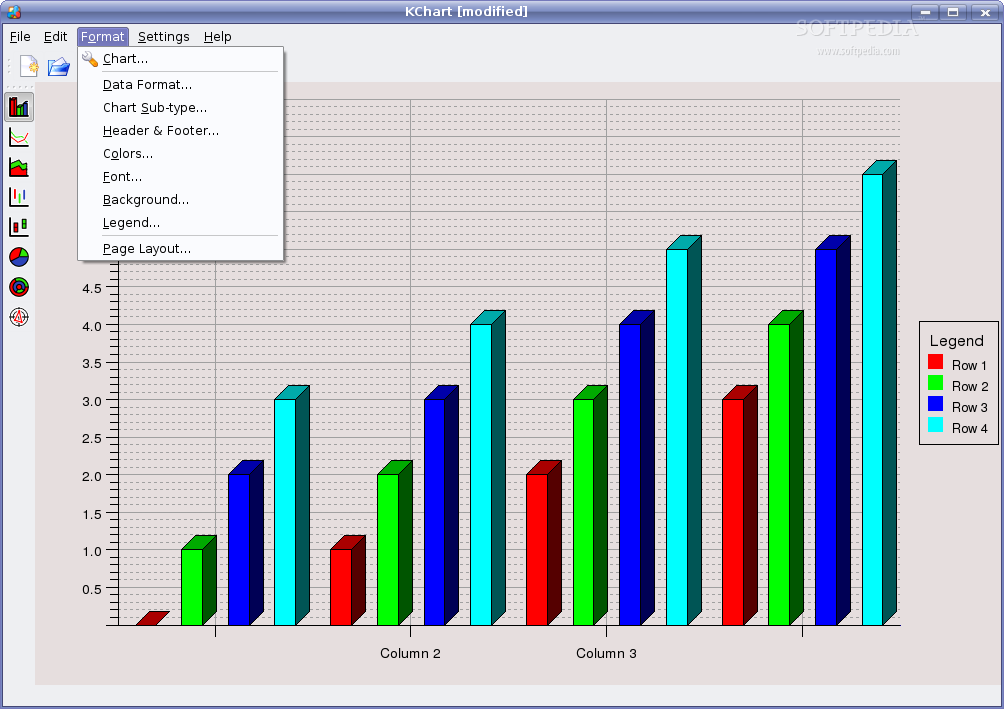
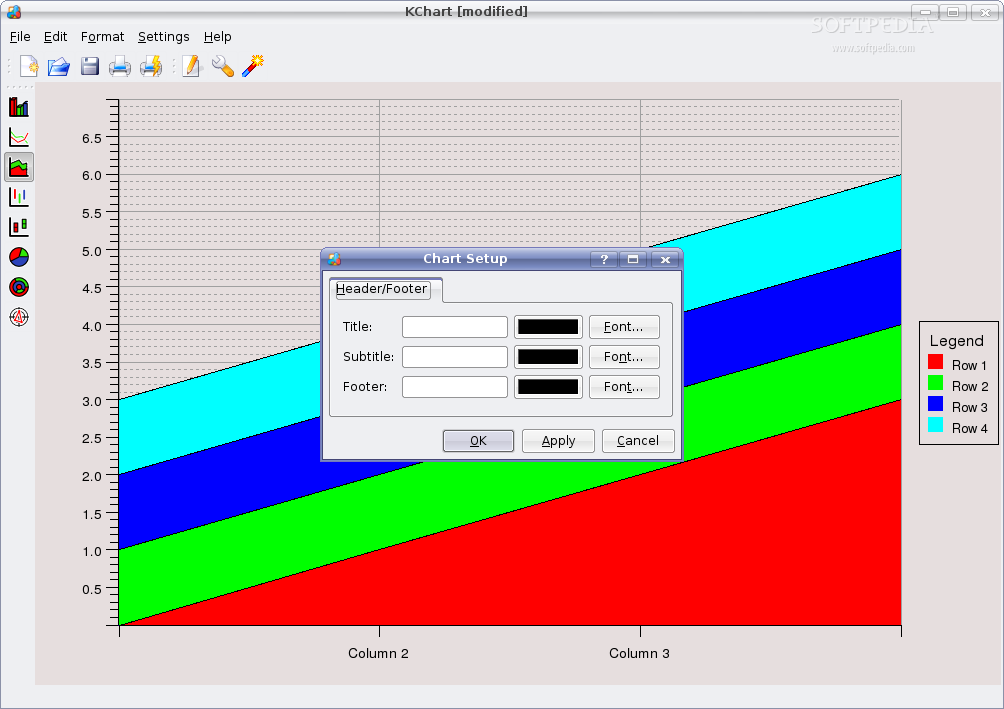
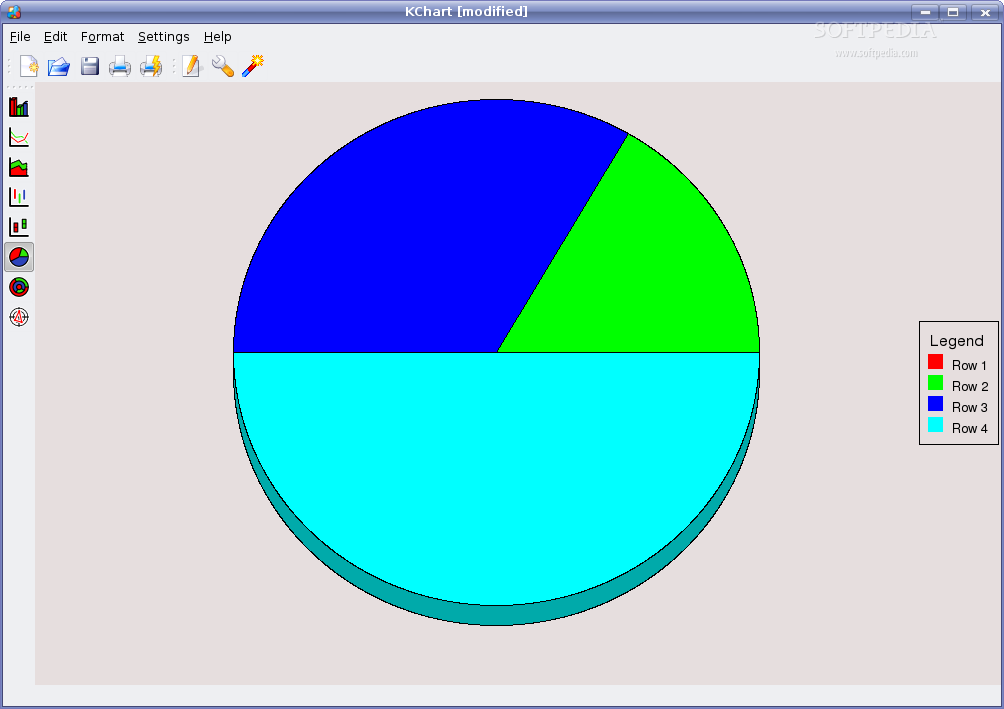
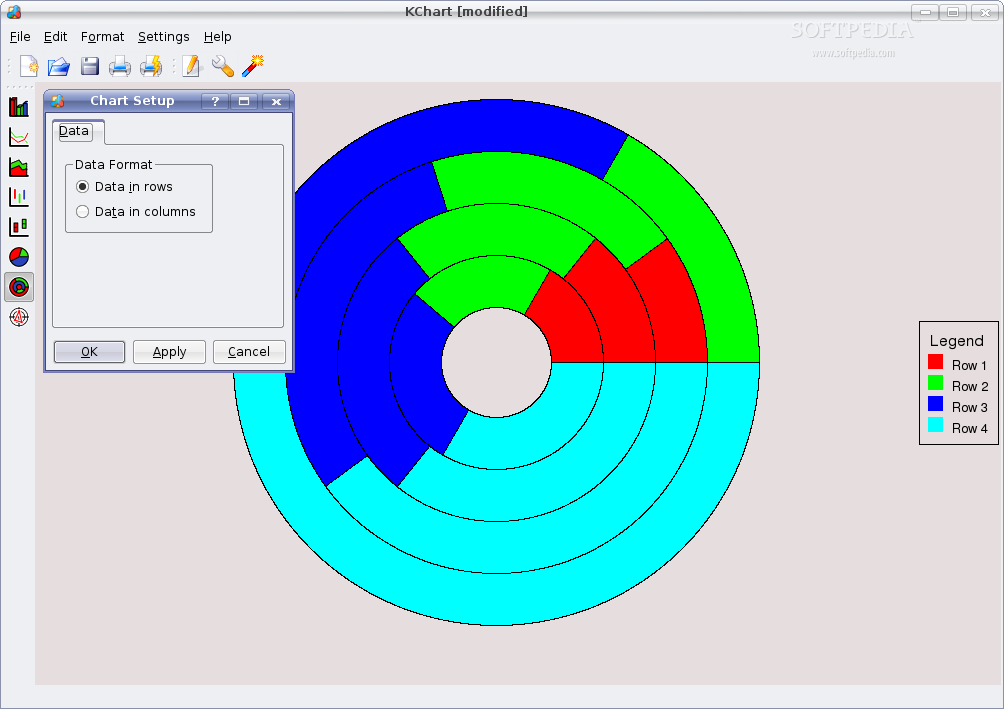
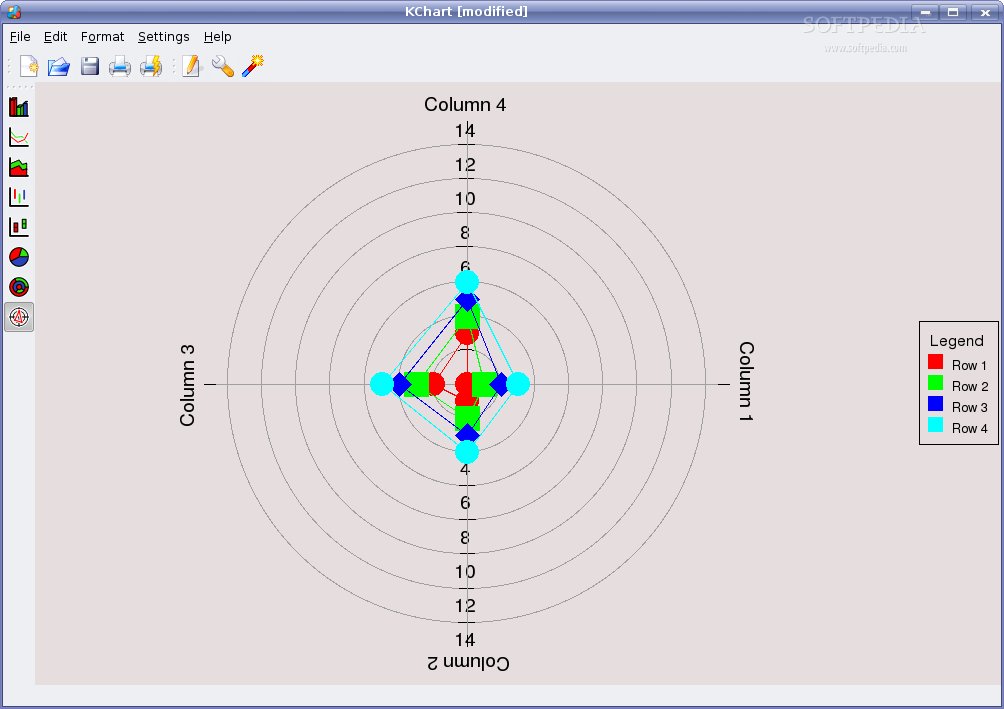
One thing I like about KChart is that it offers pretty much useful configuration options for one chart. Therefore, by selecting Format -> Chart you can select the way your chart will be drawn. There are eight patterns from which to choose, including Bars, Pipes, Areas, Lines, Rings or, my favorite, Polar. You will be able to choose the data interpretation, by using either rows or columns. Here is the place where you'll edit the title and subtitle too, for each of them using a different font type, size or color. Here you can also custom the X,Y axis and also use the 3D parameters in order to get a 3D effect on the chart. In order to do that, just go to the Bar tab in the Format data dialog box and fill in your options.
Regarding the previous releases of KChart, I've heard many complaining about the way it prints out the chart. But this is no longer true for this version. A chart can be exported as a graphic file. In order to do that, choose File -> Export and then select the file format you need. You can choose between graphic formats such as: SVG, PNG, JPEG, Krita, Gimp etc.
The Good
KChart benefits from a highly flexible integration. It is used by KSpread to create diagrams and charts, but it can also be used as a standalone application. The embedding goes much further and a chart can be inserted in many of the KOffice components.
The Bad
I find KChart a nice program especially due to the fact that it can be easily used. There are many aspects about it that I do not like, though. And the most outstanding example would be the shabby GUI. The interface plays an important role in the way a user interacts with an application. KChart's UI looks very primitive and somehow reminds me of the obsolete programs from the '90s.
The Truth
A useful KOffice component, KChart is a good charts-drawing program. It allows the user to create many types of charts and also allows links to the underlying data, so when the applications involved are open, a data change in one is reflected in the others.
Please enjoy the KChart screenshots below: