14 DAY TRIAL //
 We talked about a lot of types of applications useful for most of the Linux users. It is now time to say something for people that are into science or maybe even better, into scientific academic activities. The truth is that for these people good, specialized applications are very rare and also very expensive. Support for Linux is almost inexistent.
Anyway, the application that is reviewed today is very good for several domains. All the objects that surround us are built of atoms that are bonded together. At the base of any material are the elements of the periodic table. To understand basic concepts about the world, you would definitely need to have basic knowledge of physics and chemistry. Let's take a simple example - the light bulb. It is one of the most common objects around and still more than 90% of the people don't know the basics about how it works. Believe it or not, there's a lot of science behind building the common cheap light bulb, but the functioning principle of how it works is very simple. To understand a lot more about the world that surrounds us you will have to know the periodic table very well so you can be able to start with quantum mechanics.
Maybe I got a little carried away - or maybe not - but in Linux there is a great application which will show a host of information about the periodic system of elements: Kalzium. It has been improved a lot lately and it can evolve into an even better program.
Let's see what it has to offer
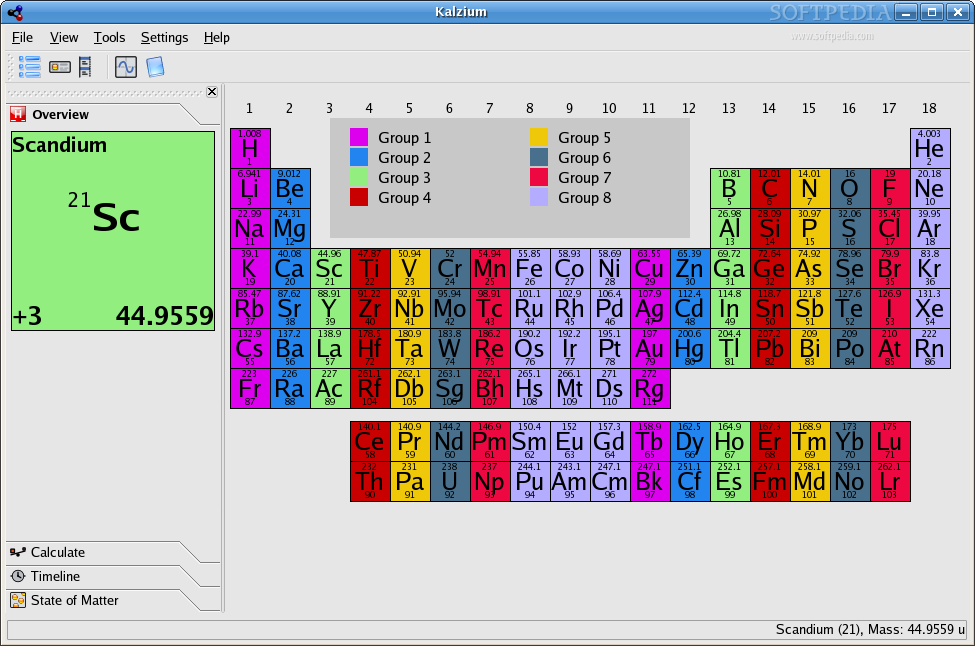
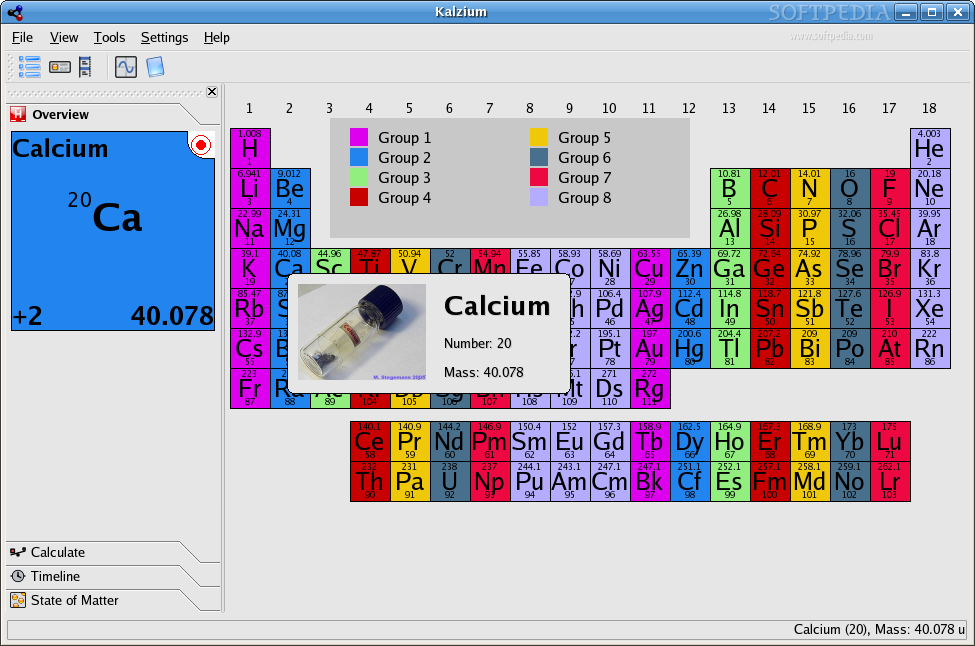
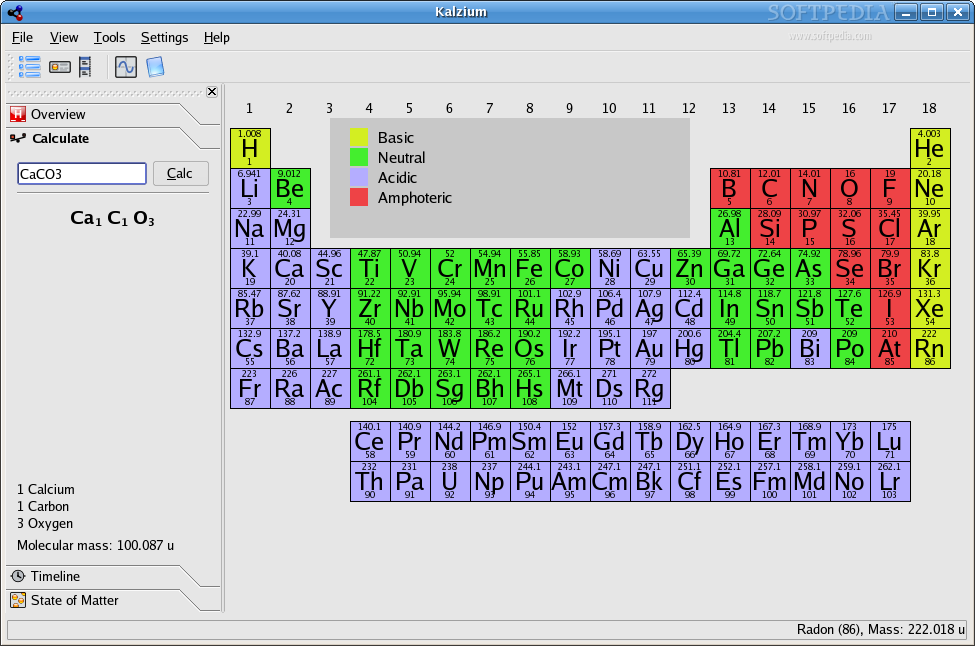
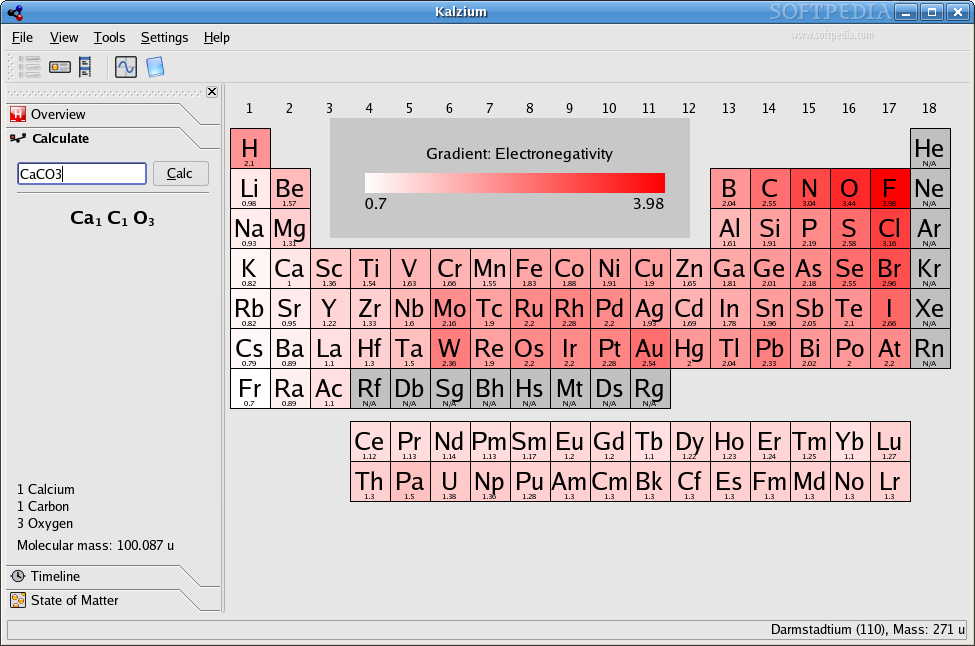
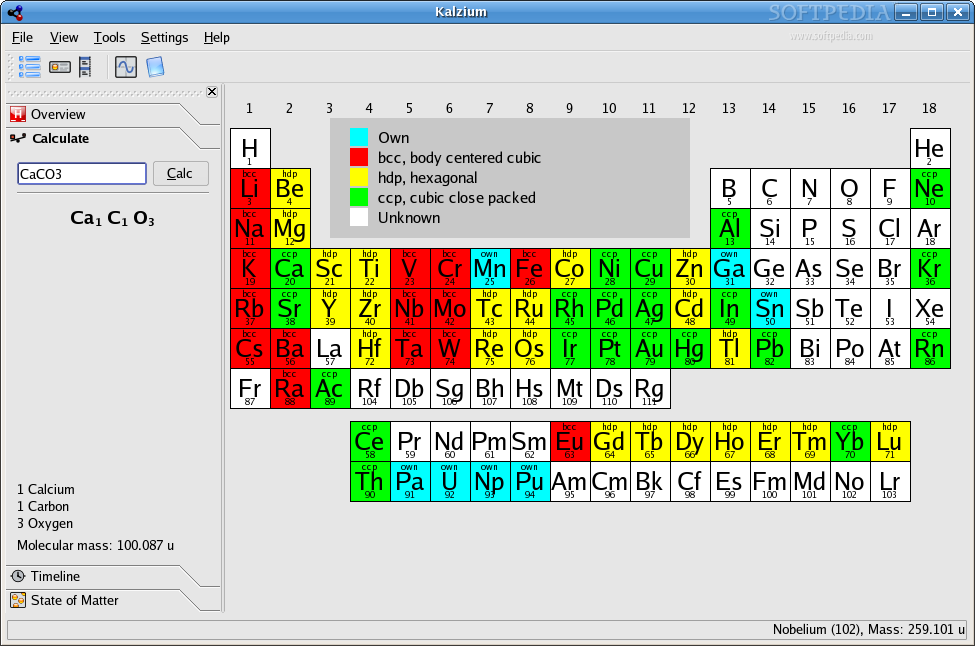
When you open Kalzium, the first thing you see is the periodic table. Actually, this is where everything begins. The periodic table can be viewed using colors for better expressing things like groups, family, the chemical character, the structure and also several gradients. All these viewing modes are very useful and allow a better understanding of chemistry. All the colors can be easily customized from the configure window. Other settings control what units are used for temperatures or energies. Even if this feature may not seem much, it will really come in handy if you are used to work in Celsius. The way groups are enumerated can be also changed using the IUPAC, CAS or the old IUPAC systems.
In the left side of the periodic table there are several tabs used for different tasks. The first tab shows an overview for each substance. Generally, here isn't displayed much; it is almost the same info that can be seen in the PSE. You can see, in addition, the name of the element in the upper left corner, sometimes more decimals regarding the atomic mass and the most important, oxidation stages.
The second tab shows a simple calculator that computes the molecular mass of a simple substance. At the top of the widget where the empirical formula of what you want to calculate is displayed, a tooltip may appear showing the cumulative mass of each element. The result of the computation is at the bottom of the widget.
The next tab is Timeline. It displays a history of elements. It is fun to see how the periodic table evolved over time. The timeline starts with the year 1650 and shows that the first element discovered is phosphorus, in 1669. Well, I'm not 100% sure but as far as I know it was discovered in 1649. More important is to know that at that point there wasn't a periodic table. It appeared in the late 19th century and it is considered that the father of the table is Dmitri Mendeleev. He demonstrated the periodic nature of the elements, but scientists of the 20th century explained why the proprieties recur periodically. A lot of scientists have contributed to this table so I guess they also deserve some recognition. I think it is appropriate to have their names in the remaining space of the timeline widget. Currently, there is a slider that when you move it left and right elements appear and disappear. It is enough space left for displaying the element(s) that was discovered and who did the discovery. Anyway I like the timeline and I think it is a great addition to Kalzium.
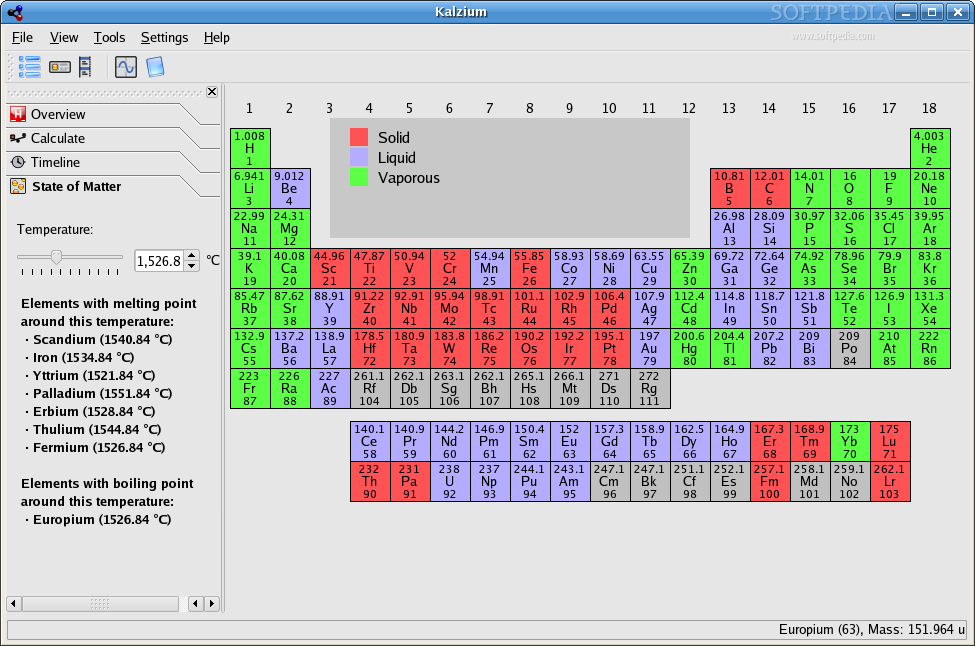
The last tab displays the State of Matter. This is one of my favorite features of Kalzium, because it displays, in a nice graphical manner, what is the state of each element at a certain temperature.
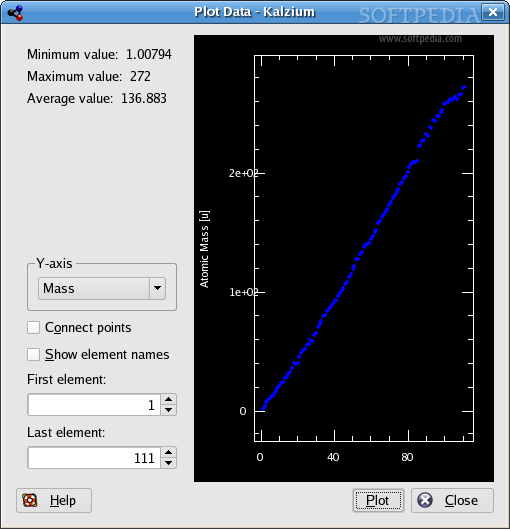
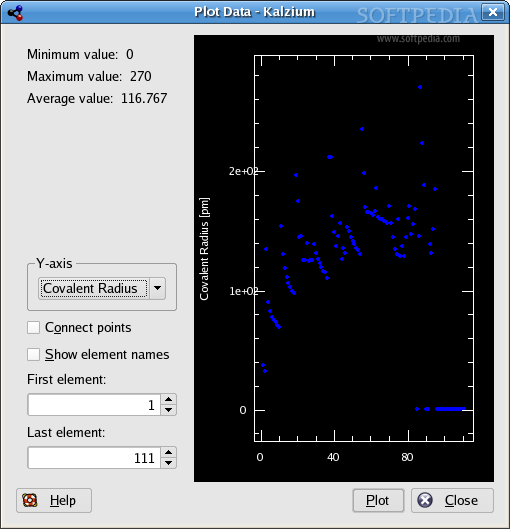
Kalzium has a very cool feature: being able to plot data from the periodic table. It can plot several aspects on the Y-axis, like the mass or the boiling point, and it also lets you choose what is the first element and which is the last that gets plotted. If it had a text box where you can add the name or the number of the elements you would like to get plotted this would have been a really useful feature.
Information regarding each element.
Clicking each element opens an impressive information box. On the left side are displayed the types of data available and on the right side is shown the data that corresponds to what you select.
First is the overview. This is the same overview that we have in the main window. I like to think of it as the cover.
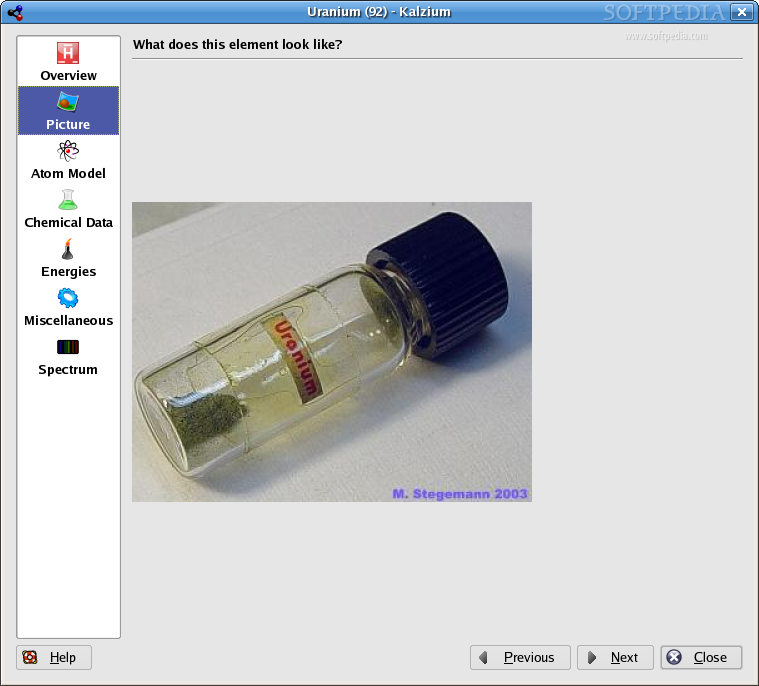
The second is a picture of the element. I'd like to think of this as a neat feature. It arouses curiosity in the minds of some people, maybe even in mine. It can't be practical because the looks of a chemical is influenced by its structure. For example, the graphite and the diamond are bots states of carbon.
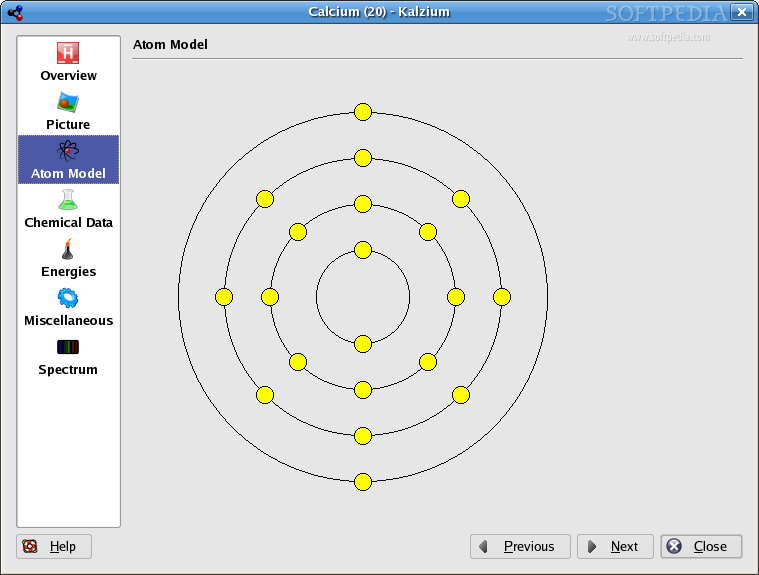
The atomic model is a nice display of how elements are arranged. It would also be nice here to have the electronic configuration written underneath the picture.
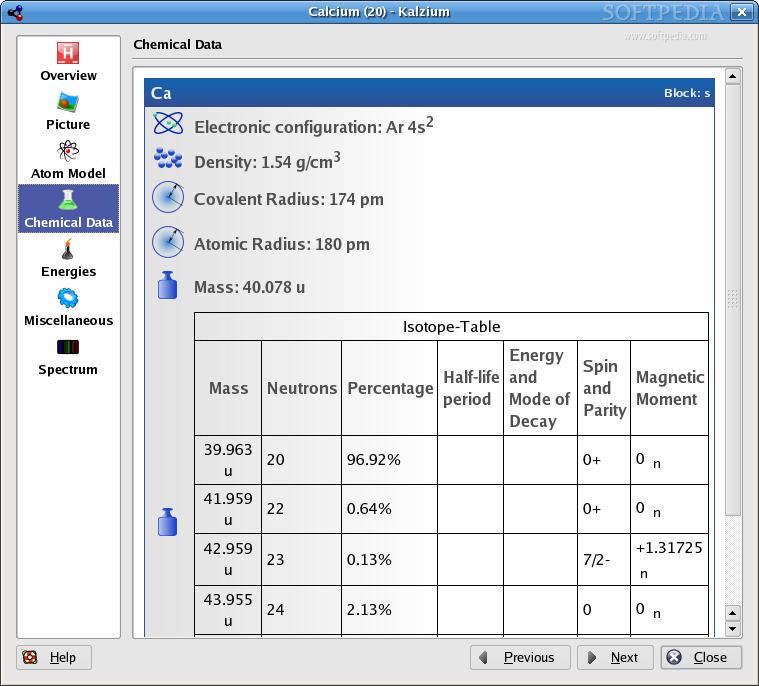
The electronic configuration is the first thing that comes up in the section for chemical data. This is the most scientific data the program has to offer, and for kids this might be too much, for high school students is more than enough but for people that know what chemistry is all about only the isotope table just doesn't cut it. There should be more information here.
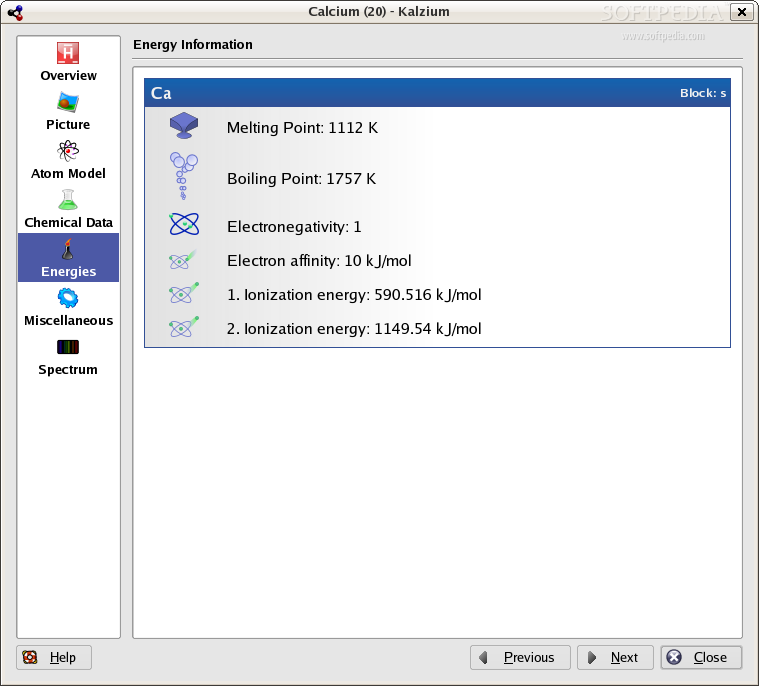
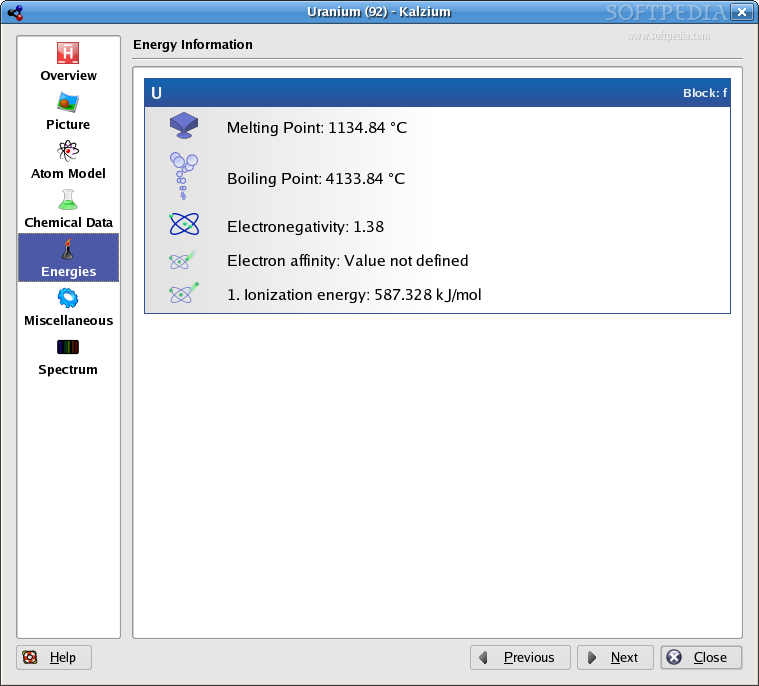
Information related to different energies is displayed after the chemical data. Some of this information I would put in the sector for chemical data and I would rename this reaction to Physical Data for what is left. In this configuration it is still interesting but then, again, more things need to be added.
The miscellaneous data are interesting. The first thing that is displayed is the history of the element. As I was saying earlier, this would be nice to get displayed also in the timeline. Next is the abundance in rocks. At the present time is a bug here, because all the elements have the same abundance of 12 parts per million. Another thing that I like is that the original name is also shown here and it specifies what its origin is. If an element is artificial the program shows one last line specifying this aspect.
Last but definitely not least is the spectrum. Some of the elements have information about the emission-spectrum. This feature is implemented very nicely because it's not just a picture scanned from a book. The spectral lines are colored accordingly to their value and the spectrum can be zoomed in and also exported as a picture. Exporting is nice if you want to attach this info in a document. Excellent job on this one. I'm just hoping for a complete database.
The Good
The way this software is designed is great. It just screams expandability. Even if it has much more than an average person needs, I feel that it can be expanded to something very useful to professionals as well.
The Bad
The information included is sometimes (rarely) inaccurate, but I'm not sure this can be blamed on the developers, because even the best books out there have slightly different values from one author to another. It still has some minor bugs but I'm sure this is not a big problem.
The Truth
The absolute truth is that in this review I have criticized this software a lot, but only because I think it can be a lot more with it. The truth is that it is a great tool for students and also a nice one for enthusiasts.
Check out the screenshots below: