14 DAY TRIAL //
 Our last review was about a UML modeling tool called ArgoUML, a very complex application which takes some time to get used to and requires advanced knowledge about fundamental concepts in OOP in order to accomplish something notable. This is not the case with today's application, as with just basic computer know-how, anyone can begin their adventure of constructing their very own social network model.
To put it simply, SocNetV (Social Network Visualiser) is mainly a tool for social network analysis, editing and, of course, viewing. As usual, I'd like to take a moment and give you some details about the primary concept this software exploits (social network), the understanding of which is very important. It seems only reasonable that when you take a first look at a program, you want (after you are first explained what is it good for) to know how that kind of software was developed and which are the needs it addresses.
Well, like many questions related to the origin of computer software, the one above hasn't got just one answer, or more appropriately, even if it did at the time the application was first designed, that sure changed as it was soon discovered that various problems, other than the primary tasks, could be successfully dealt with by using it.
A social network is a structure, often very complex, having two basic components: nodes and ties. This is, of course, the concept brought to its abstract form in order to be better grasped by aspiring social studies gurus. From here on, I'll assume that you have at least a pretty good idea as to what a graph is and how it is most often represented, because a social network representation relies on basic standards borrowed from the graph theory that you cannot do without. So, nodes can stand for people, companies, countries, organizations, post offices, gas stations and so on. Ties represent what exactly connects the elements represented by nodes. It's all abstract thinking here; in other words, everything has a hidden signification. I'd better give you an example or two to shed some light over what I've been trying to say. It's important not to move on until you are absolutely sure you understood everything that's been discussed up to a certain point.
Think of a company that resides within a four-story building and, on each story, there are twenty to thirty people working. The people who work in that building form a social network, but how, intuitively, would the representation of this network look like? Well, it depends very much on the criteria you place on the ties. But let's take the simple one for now, remembering that it's up to us what we want to model. For instance, suppose we want to see a model of the company's staff regarding how much they talk to each other. It's fair to presume that people talk mostly with those on the same floor, so the graph would generally look like four clusters (as there are four floors), each with as many nodes as there are employees on that specific floor. Each tie between two nodes signifies that the people represented by those two nodes have spoken at least once in that day. So, within a cluster, there will be far more ties than between nodes from different clusters. Occasionally, an employee could go to a different floor and talk to someone from a different department - that's how two clusters communicate. As much as this example simulates real life, please take into consideration that this is merely a generic one, because we did not take into account the possibility for two staff members to talk using an instant messenger or over the phone.
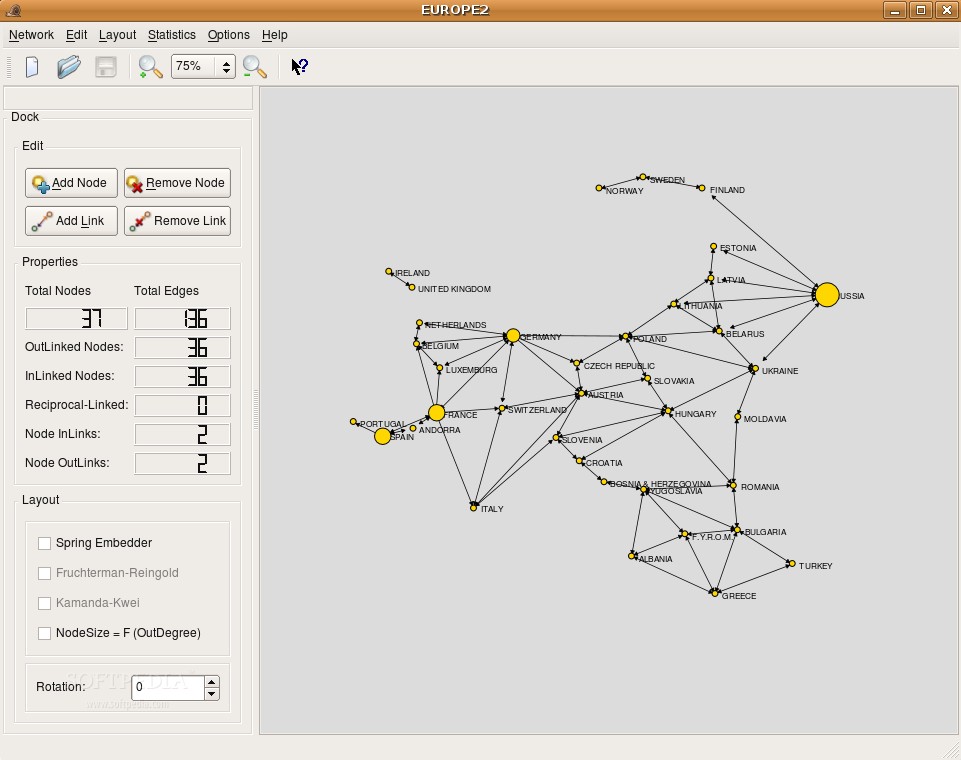
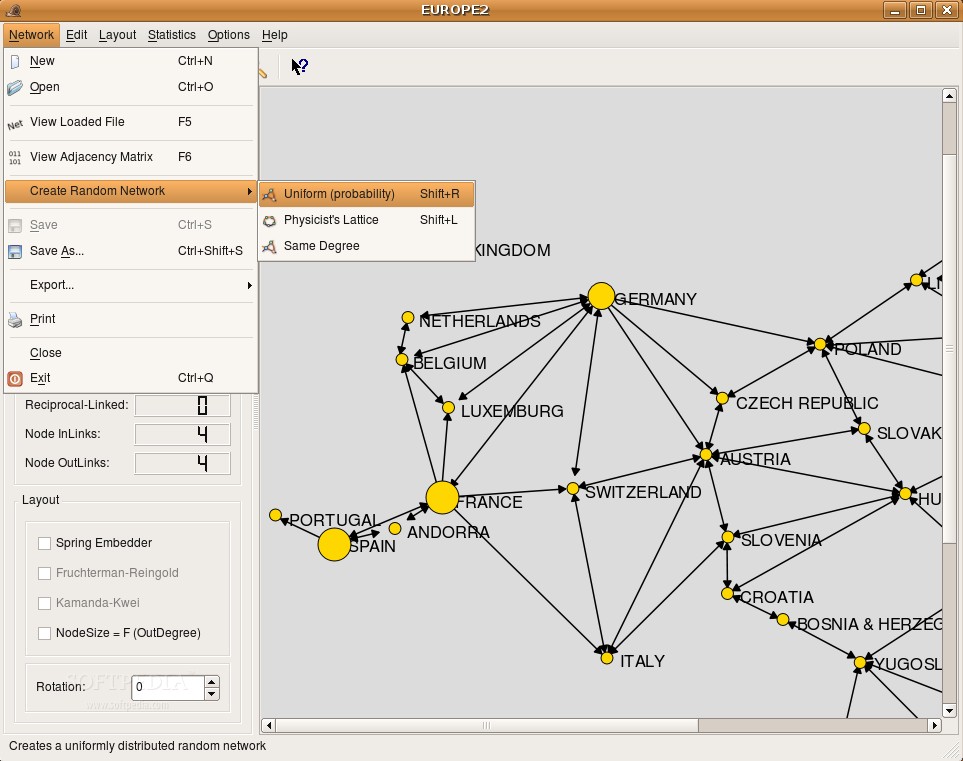
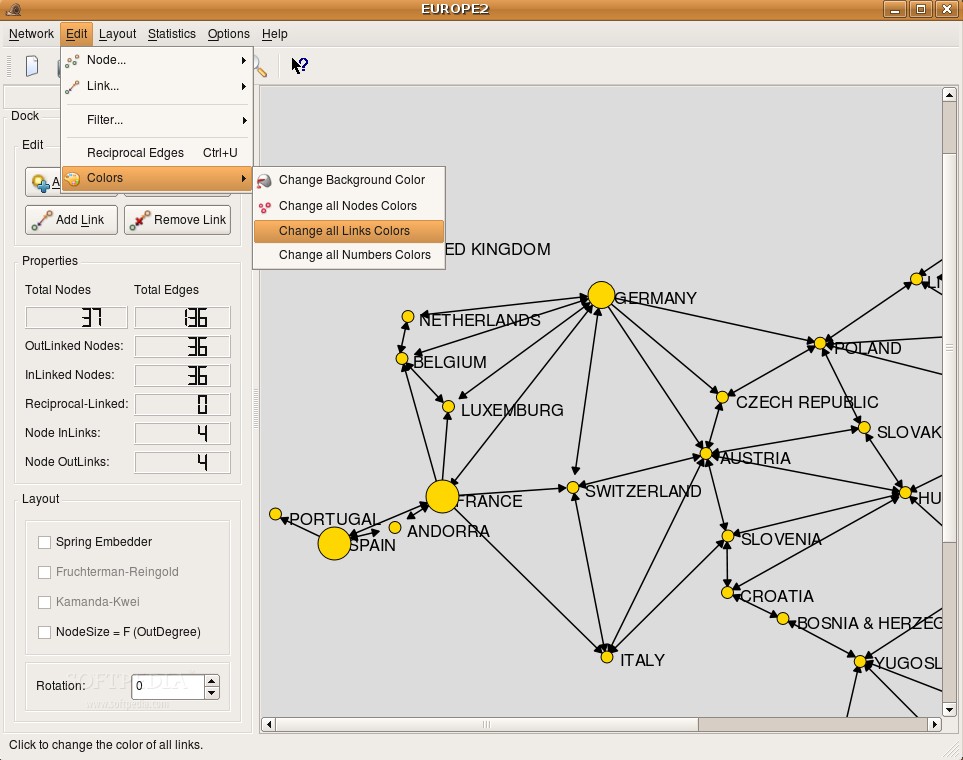
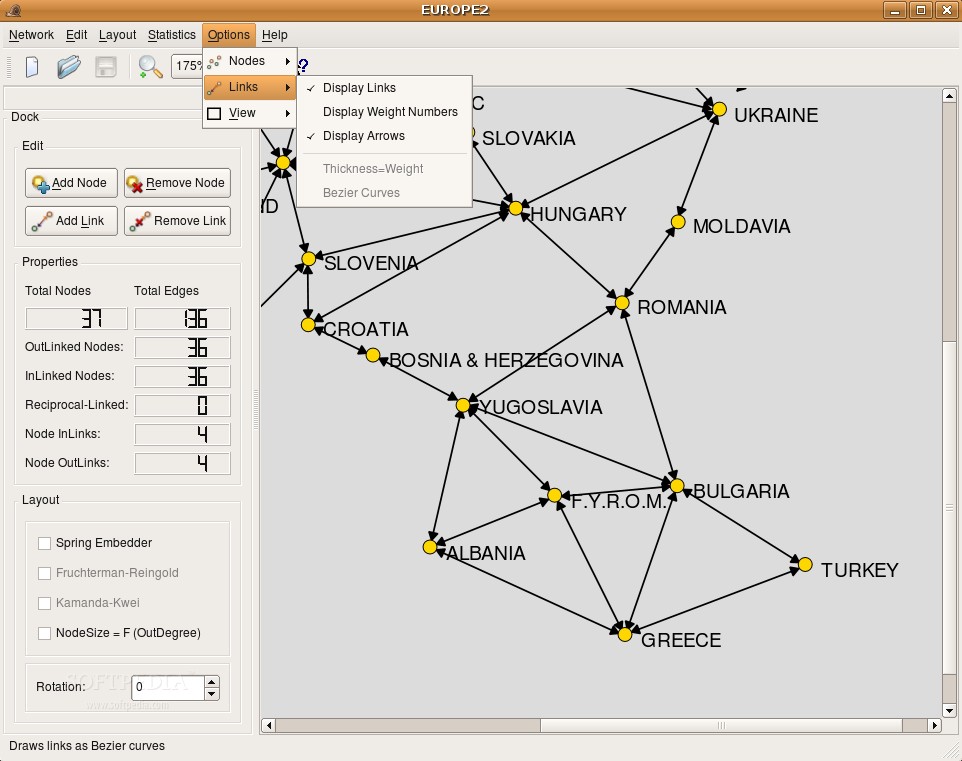
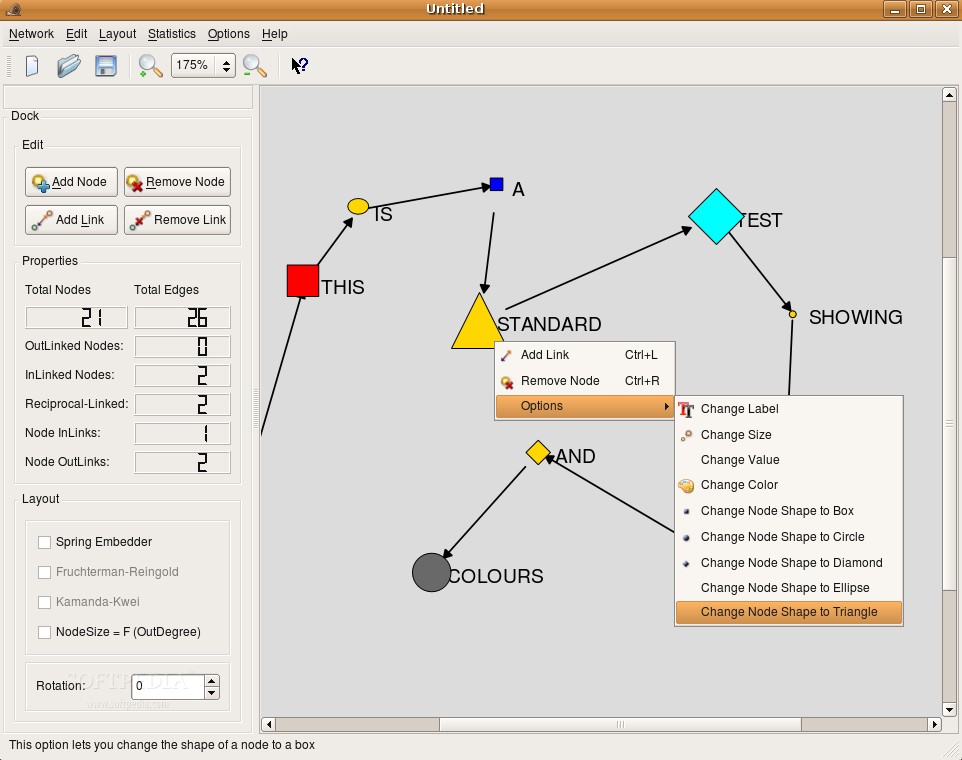
As you'll see from the pictures below, SocNetV is suited exactly for this kind of job, offering everything for you to immediately start creating the social network model of your choice. I personally played around and came up with the idea of creating Europe's model by attributing each country to a node and each land border between two countries to a tie. It was really no problem finishing well under twenty minutes or so, thanks to SocNetV's easy to use and simple to understand and apply functionality. You have all the tools you need in order to design any model you desire; from node and link creation to changing the shape or color of certain nodes, all respects the purpose of this application. To give you a brief example here, you could represent the social network in which nodes would stand for towns from a state and ties would be trade relations. You could then modify the size of a node according to its population (the bigger the number of people living there, the bigger the node), the shape according to what it produces most (if it's food, a circle - heavy industry, a square, and virtually any combination you could think of).
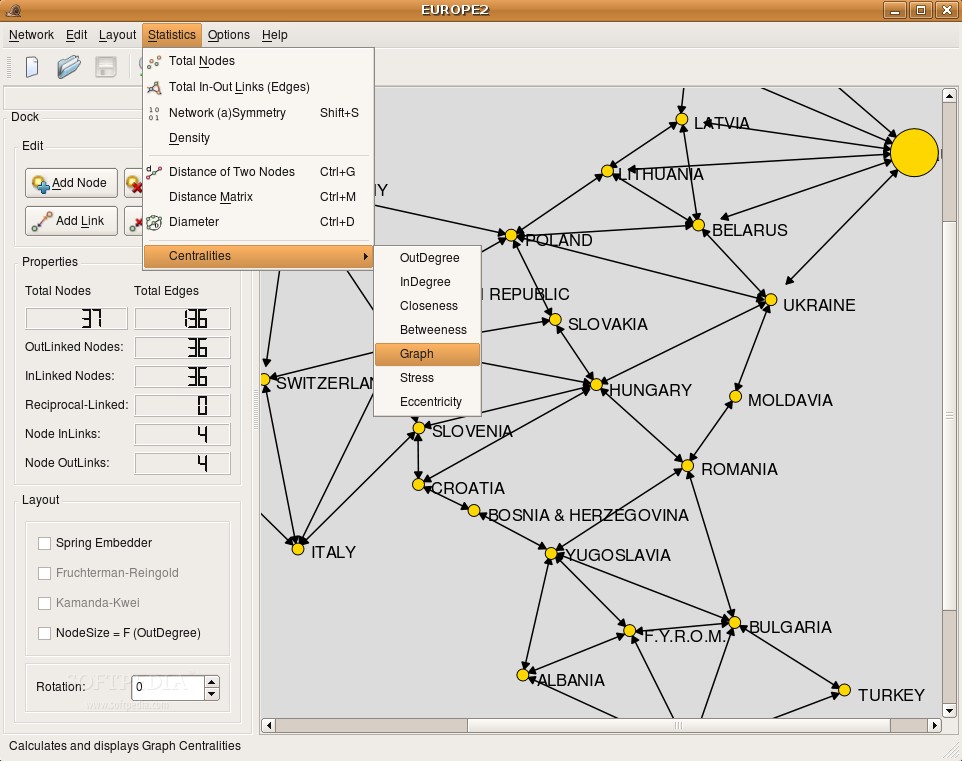
SocNetV offers network analysis tools that really come in handy when a comparison is required between two models or when you want to extract certain information. To name just a few of them, here is what SocNetV offers:
· Density; · Distance of two nodes; · The Distance Matrix; · Diameter; · Centralities according to OutDegree, InDegree, Closeness, Betweenness, etc.
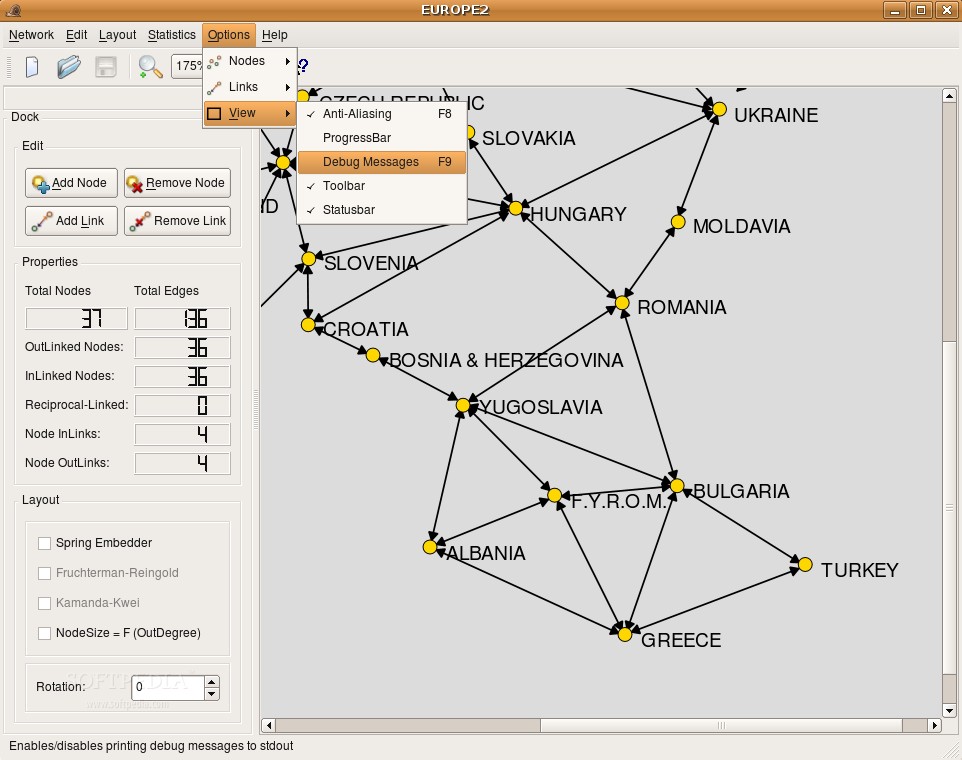
As for the view control, there are a few ways you can look at a model, depending very much on what you want to accomplish and what your models stand for. You can choose to view the label and the number of a node (or just one of them), the weight and arrows of ties and also the various control bars (status bar, tool bar, progress bar); you can also switch on and off the anti-aliasing (I suggest enabling it right from the start, as it doesn't consume much of your CPU, and it's quite eye pleasing).
The Good
It has very intuitive commands, integrated in a very user friendly interface which poses no problem getting used to, granted you have basic computer experience. Its simple design and effectiveness in handling design issues make it the perfect tool to use for social network analysis.
The Bad
Sometimes when you double click on the canvas to create a node, this doesn't appear exactly on the spot, but further away, which can be pretty annoying if you zoomed in to maximum, and you created a new node, because you have to zoom out in order to reach the newly created node, move it to your desired location and then zoom back in again. Also, I would have been pleased to see features such as the minimum spanning tree (Prim and Kruskal's algorithm) or shortest path algorithms (Dijkstra, Bellman-Ford, Floyd-Warshall and A*).
The Truth
It has many more good parts than bad ones; the bad ones would rather be called suggestions than real flaws. It's a useful software, it's open source and it's free. Enjoy it!