14 DAY TRIAL //
 When we’re talking about system information utilities, there is no shortage of such software on the Internet. Moreover, most of the apps in this category are freebies. With AIDA64 things are a bit more complicated as the suite offers complete information about both hardware and software available on the system as well as a benchmark component to test system stability and hardware performance.
Unlike other software of the same feather, AIDA64 Extreme Edition comes at the price of $39.95, but the features it ushers in are worth every penny. There are three editions of the application, Extreme Edition, Extreme Engineer and Business, the first one being the cheapest of all and not differing in features from the second, except for the fact that it cannot be used commercially.
On the other hand, Business version shows remote abilities such as monitoring and control as well as command-line automation, SQL database output or software audit with File Scanner. But it lacks several hardware monitoring components, like thermal alerts, or logging of sensor values. CPU, memory and disk benchmarks are also off its feature list.
AIDA64 Extreme Edition installs quickly and does not require too much to load up. In fact, the interface pops pretty fast after launching the software. As expected, looks have been set aside in favor of functionality and ease of use. Given the amount of information available in the program a simple program window that allows you to jump from menu to menu Windows Explorer-style is the wisest choice.
A list of all the menus is present in the left hand part of the application window. There are 15 modules, each with its set of submenus. And the choices are plenty as AIDA64 manages to provide a wide array of details, which run from general info about the entire system to comprehensive notes on every piece of hardware building up your computer.
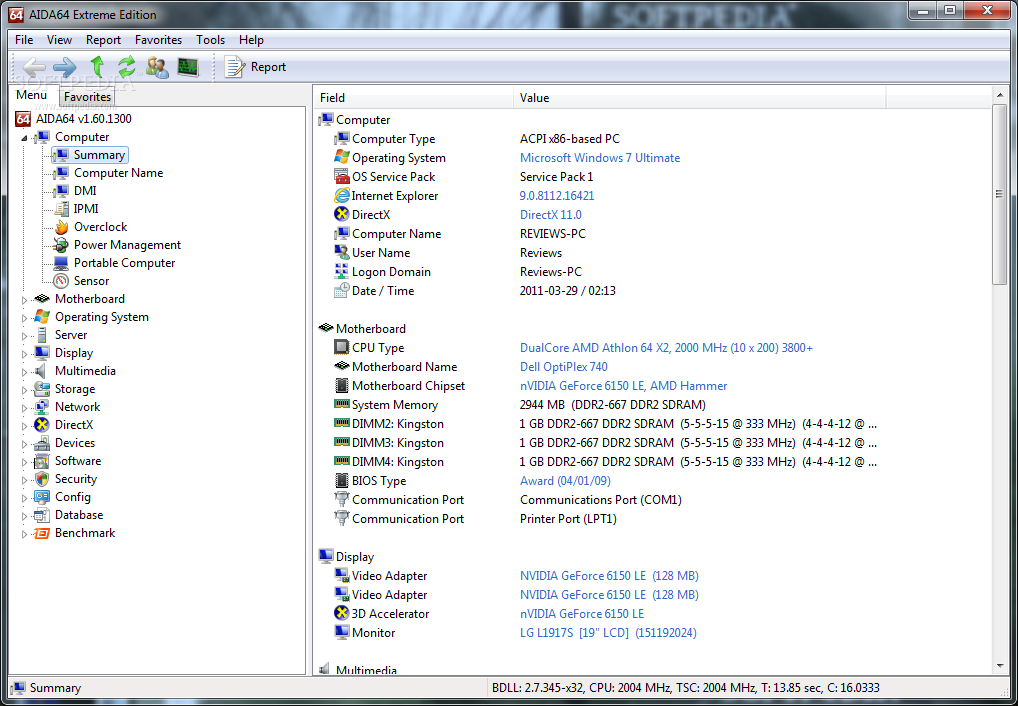
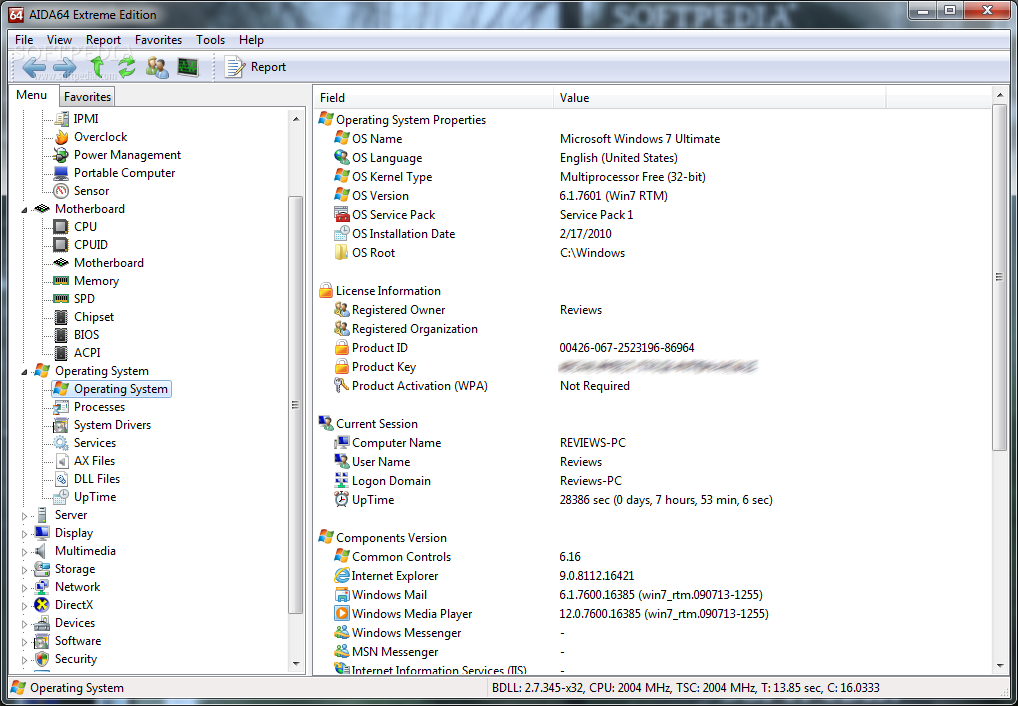
Thus, under “Computer” menu you will be able to view a summary giving you the running operating system and any service packs installed, computer name, version of Internet Explorer and DirectX available. On the hardware part AIDA64 lists the components on the motherboard, shows up the video gear on the system (monitor and adapter), storage and input devices as well as the set of peripherals.
Double clicking on each of the entries takes you deeper into the specifications of the selected entry, but you can also skip directly to any of the listed components by using the side panel.
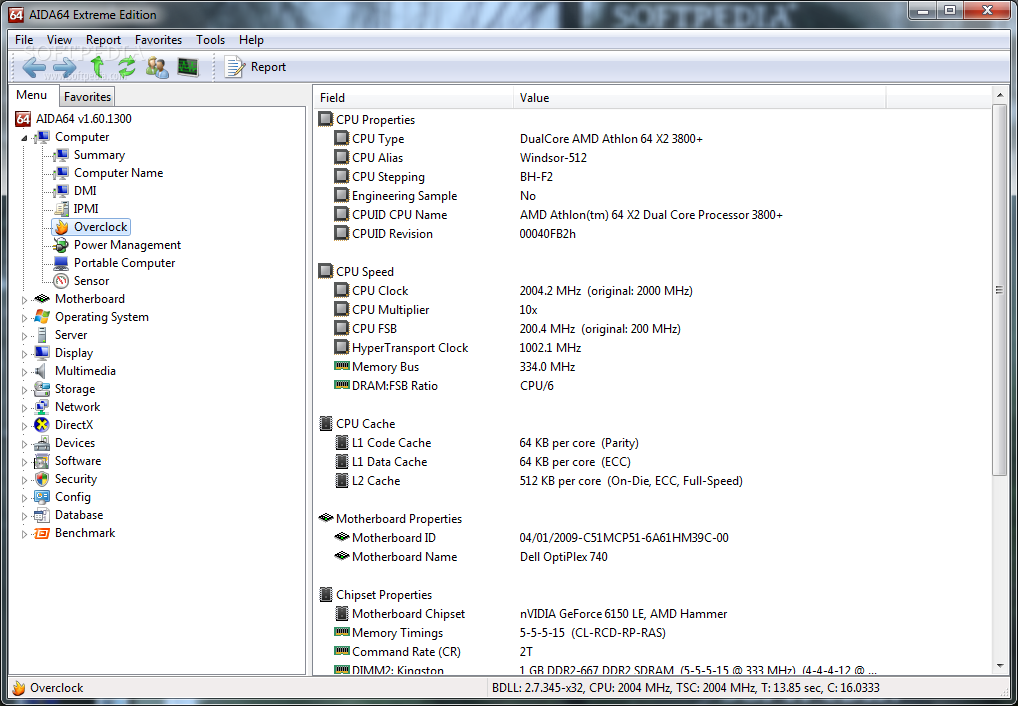
As it is also built to assist you in your overclocking endeavors, the program can also help you compare the overclocked CPU speed with the original one. We encountered some issues with the readings on our main test machine as it was equipped with an AMD 64 processor and the Cool’n’Quiet technology, which alters clock rate and voltage in order to save energy when the processor is idle. The result was a fluctuation in FSB which was perceived as an overclock and displayed accordingly. As soon as Cool’n’Quiet was disabled all the values were displayed normally.
In the case of laptops or notebooks AIDA64 will show the battery status and calculate battery lifetime and the remaining juice to power the device.
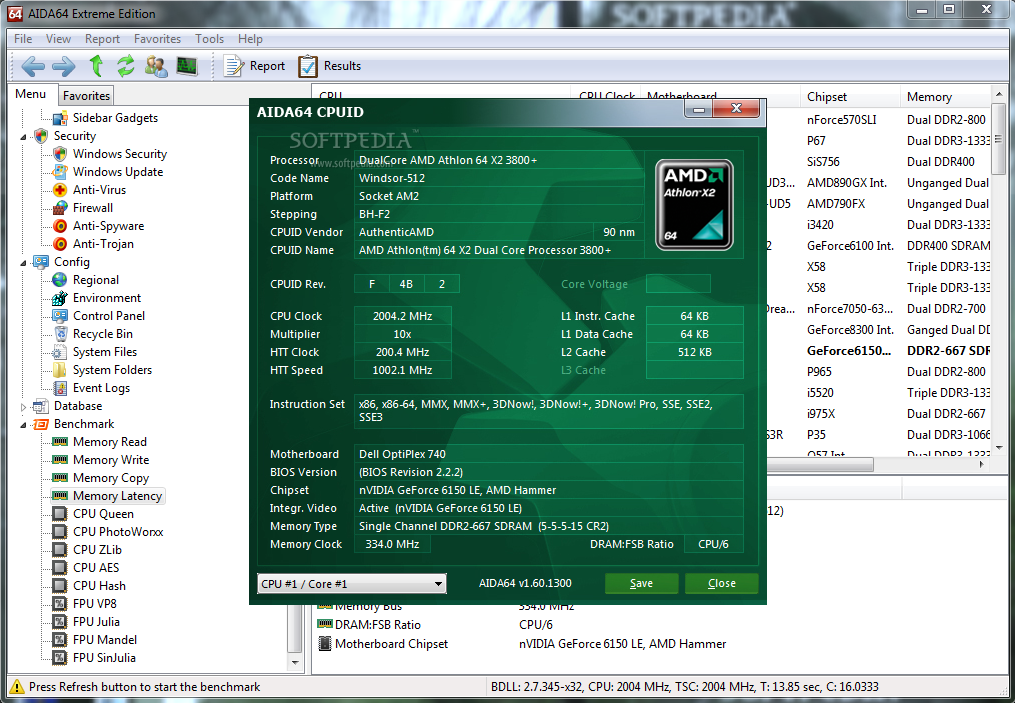
“Motherboard” menu is the core of the application because it displays information about the most important components of the system, like CPU, memory (RAM, swap space, paging file or virtual memory.), Chipset and BIOS. The application serves up even the smallest details, so you’ll benefit from comprehensive hardware information for the main pieces in the configuration.
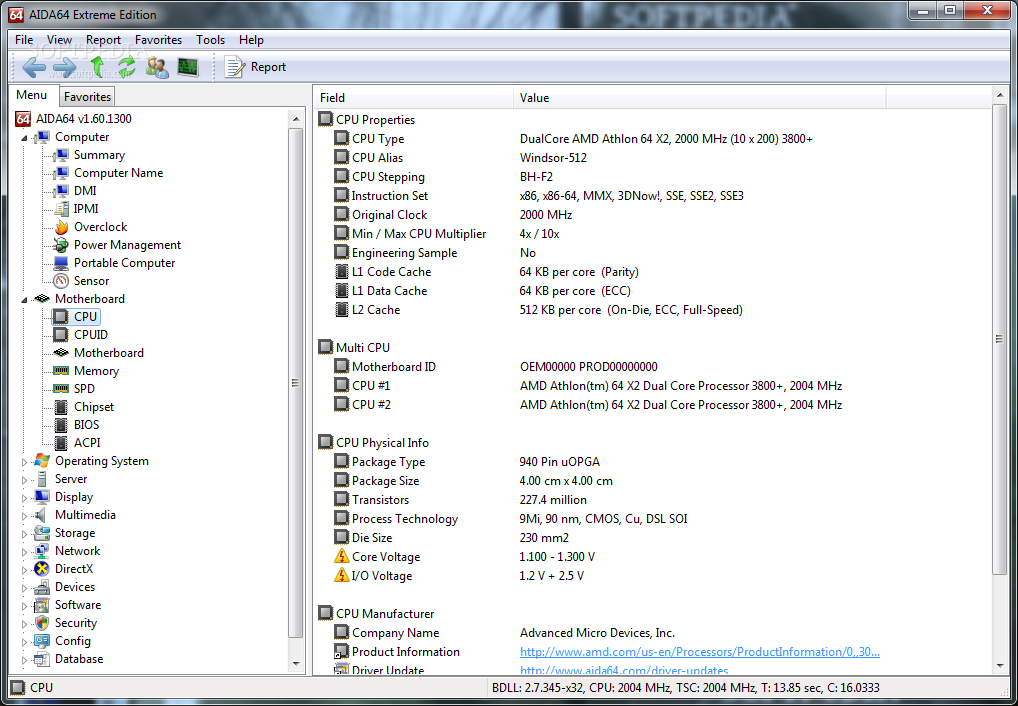
In the case of CPU sub-section AIDA64 shows the type of the processor, stepping, original clock, minimum and maximum multiplier values, L1 Code and Data Cache per core, and even number of transistors or die size. Core and I/O voltages are also mentioned in the list, just like the current CPU usage, separately for each core.
For even more detailed bits head to CPUID submenu to learn about the supported instruction sets, security features or power management abilities. The list also shows you which of the features are enabled and which are not.
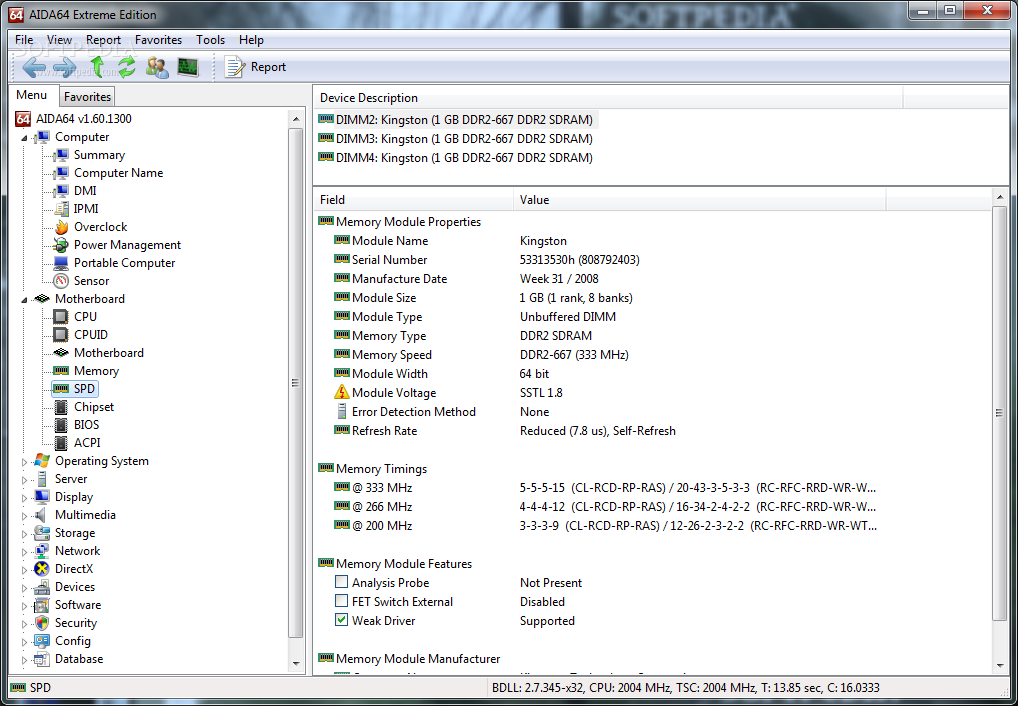
Under SPD (Serial Presence Detect) AIDA64 displays information about each RAM stick mounted on the system. Again, the amount of data shown is overwhelming as it comprises not only the brand of the module, serial number, size or manufacture date, but also important knowledge like type, speed, width, voltage or refresh rate. Memory timings are also available.
The data available for BIOS encompasses version, type and manufacturer. But besides this, there is a section for problems and suggestions, which can recommend updating BIOS to a newer version. To make things easier for you AIDA64 provides a link where you can download a tool to update your BIOS.
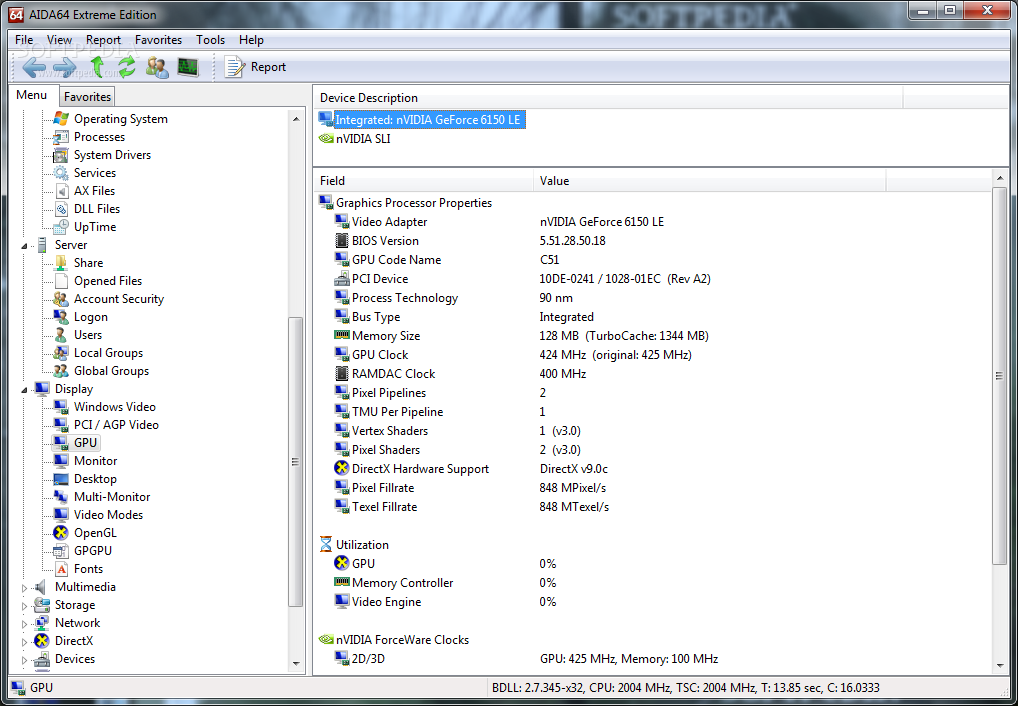
More hardware-related info can be encountered under “Display” menu. The details include data about the video card, monitor, but also minute reports on their abilities and current performance. Video adapter, BIOS version, Bus type, memory size, clock, RAMDAC clock, pixel pipelines, pixel shader version and DirectX hardware support, are all listed on the GPU sheet. Moreover, current GPU, memory controller and video engine usage are also included.
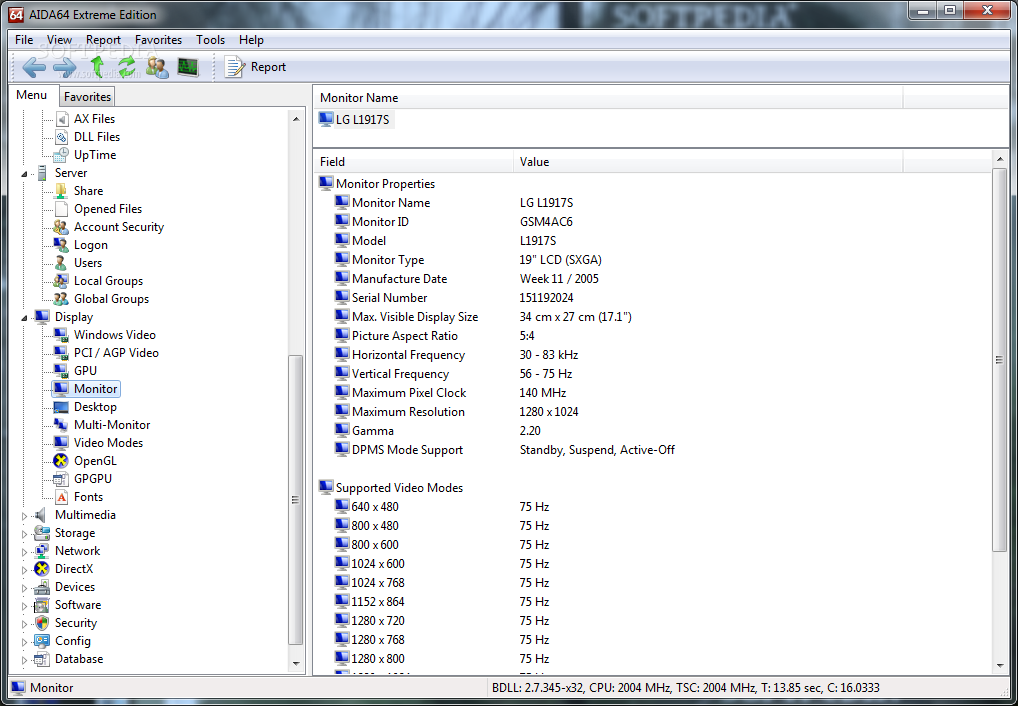
Information is equally vast in the case of the monitor and comprises details about the maximum visible display size, horizontal and vertical frequencies, maximum resolution, supported video modes. Under “Video Modes” of the “Display” menu shows all the video modes supported by the current configuration, complete with refresh rates and color depth.
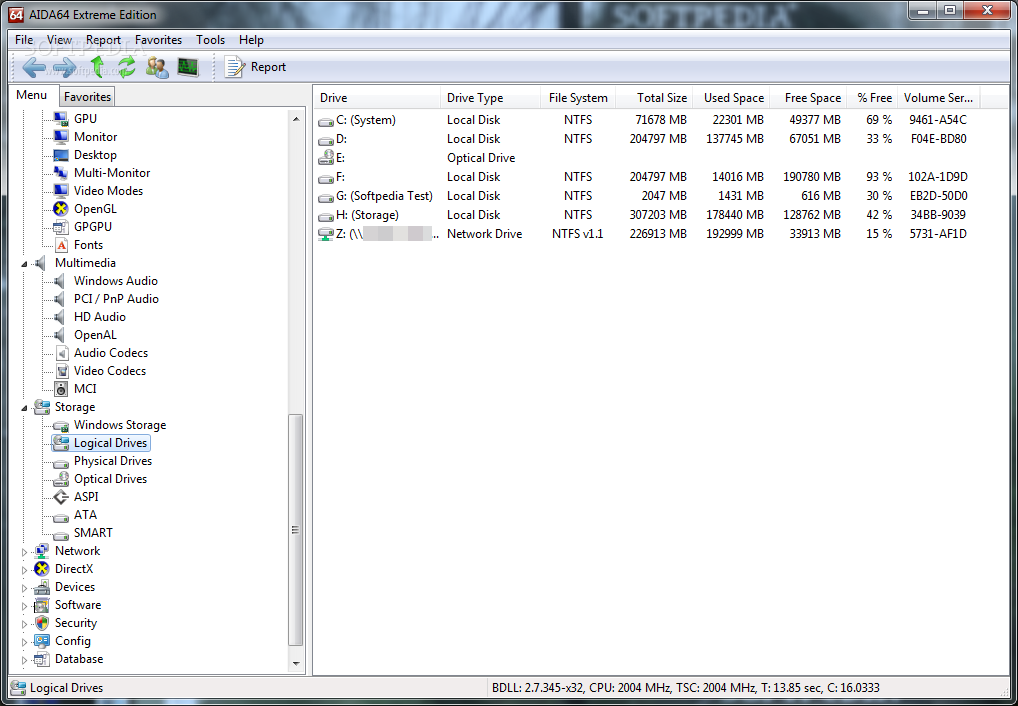
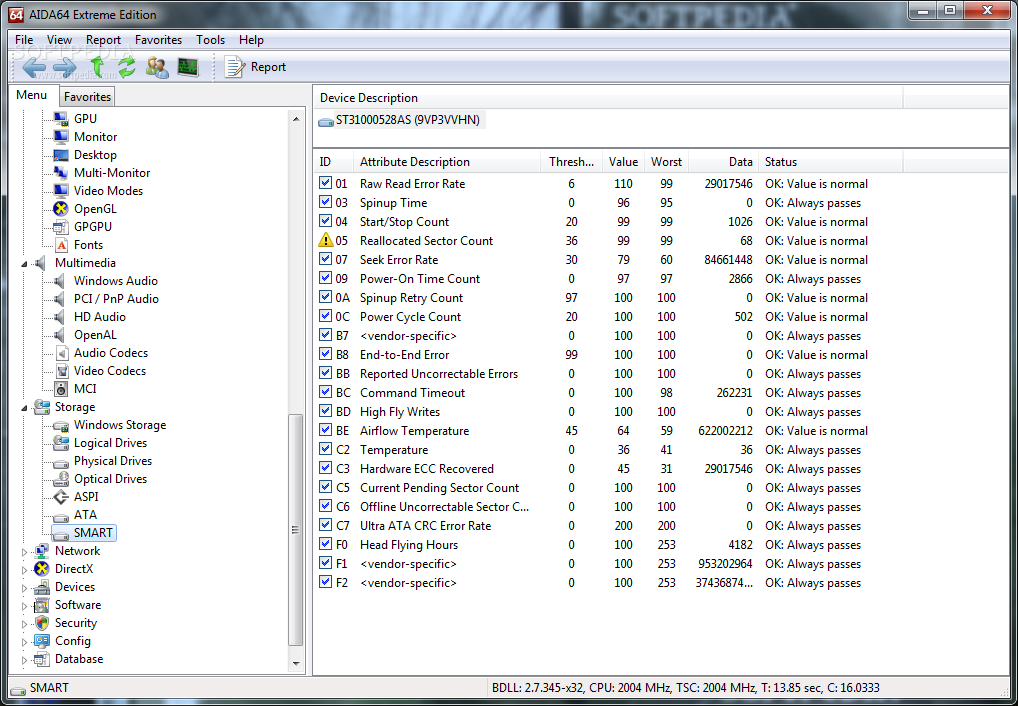
Since it is a complete system information tool AIDA64 takes into consideration storage devices as well. The details available show capacity, drive types and amount of free and used space. Additionally, performance is monitored so you can view hard disk reliability indicators. Their interpretation is provided in the screen, making it easy to learn when a drive is about to fail.
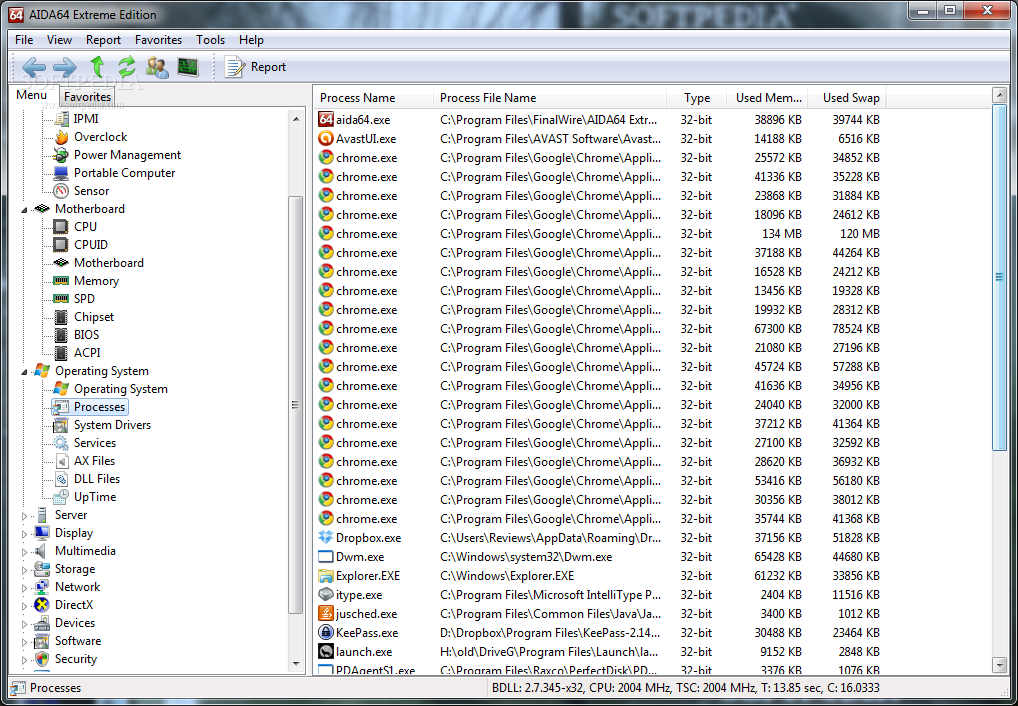
AIDA64 does not neglect the software part of your computer either. Apart from Windows elements the application puts at your disposal information about the running processes. Unfortunately it will not display it in real time, but you have a simple way to refresh the sheet by pressing F5 key.
Furthermore, AIDA64 can show the items starting with the operating system, offers the complete list of installed programs, detects the licenses for Microsoft software and displays the set of file types and the software they are associated with.
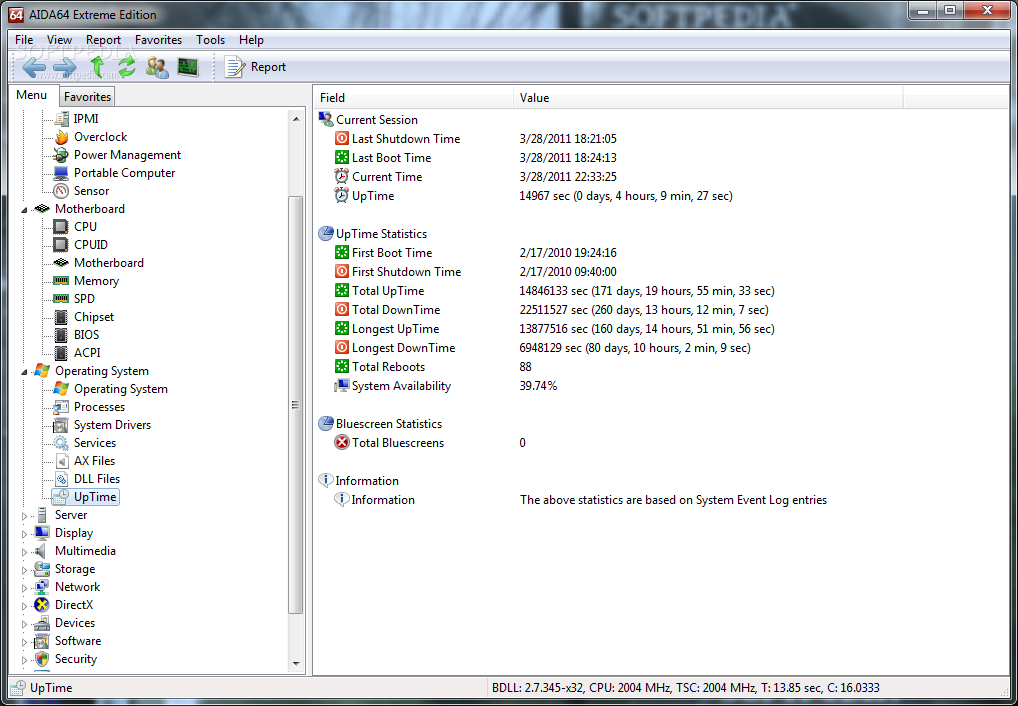
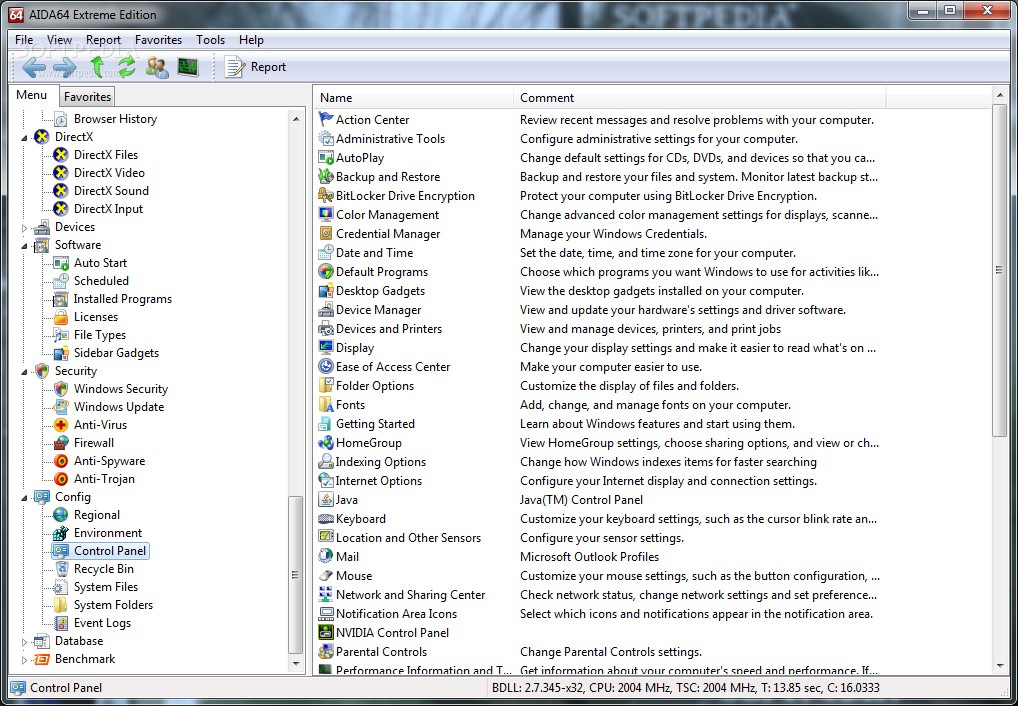
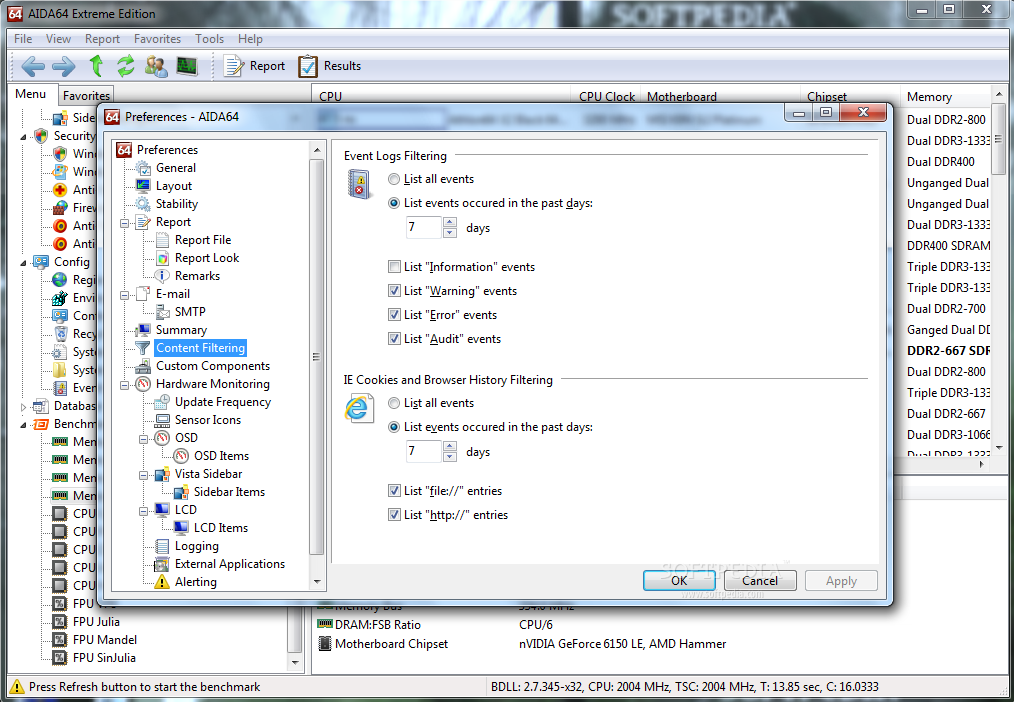
For an overall glance at the system configuration or access to the applets in Control Panel you can head to “Config” menu in the main application window. Even Event Logs, which are pretty difficult to access in Windows OS if you don’t know the steps to launching the Event Viewer, are available in this section.
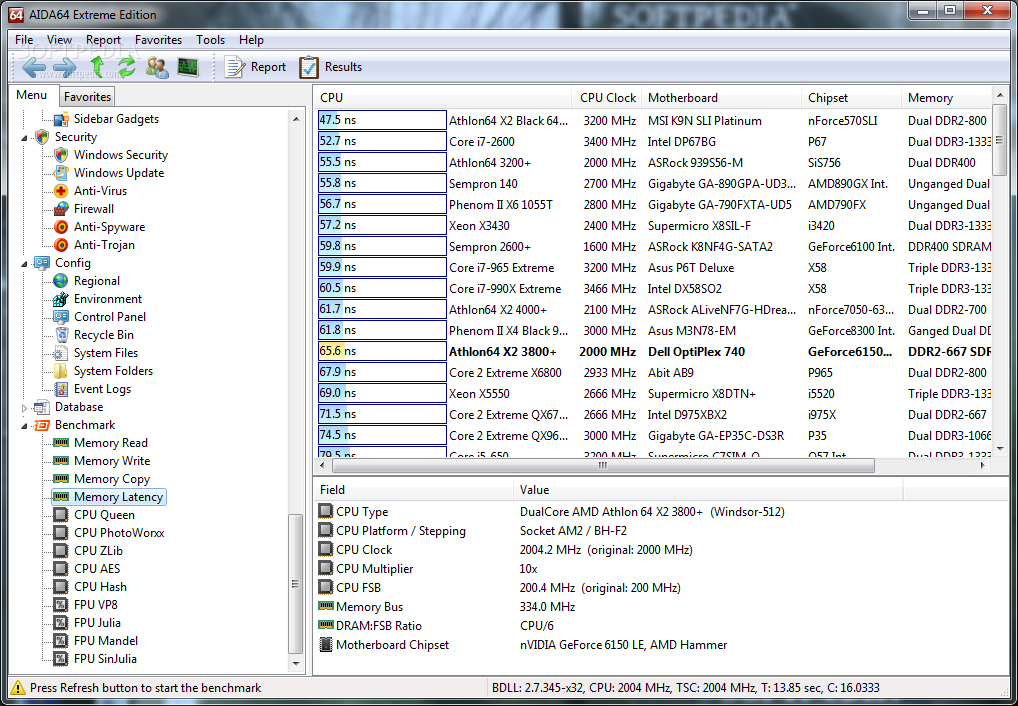
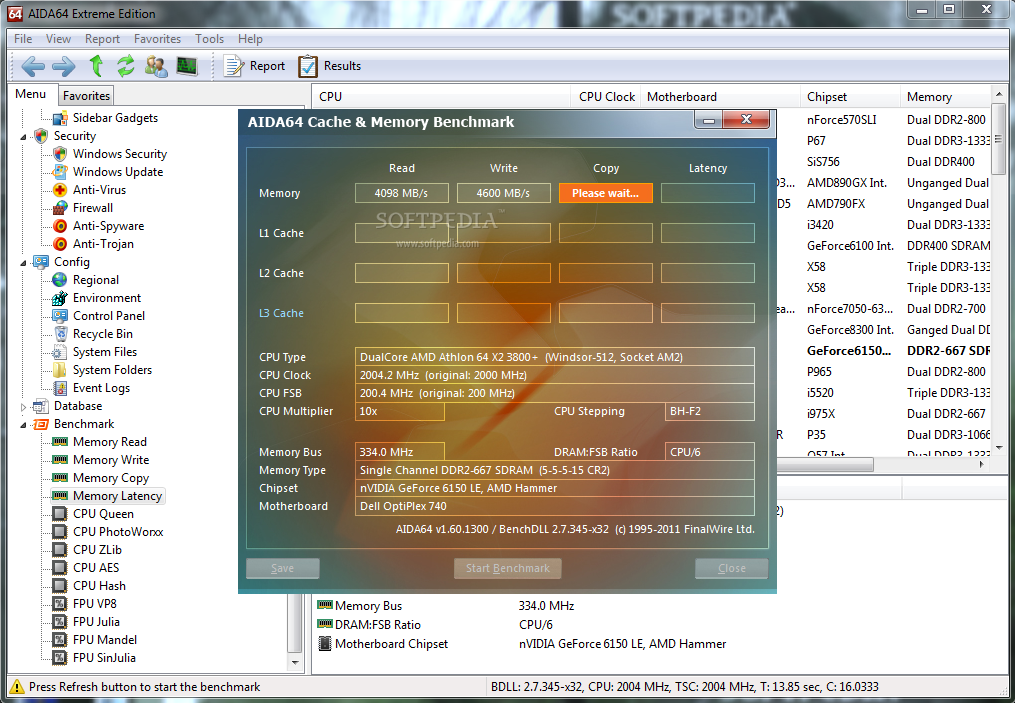
An extremely important component in AIDA64 is benchmarking. It is the last menu in the program and allows you to measure system performance. All the tests are synthetic in nature so you get to compare your system against a multitude of other configurations. As soon as the test completes your results will be shown in the comparison chart with various system configurations provided by the developer.
The set of benchmarks in AIDA64’s menu calculate the memory read, write, copy and latency, CPU performance as well as video compression performance. Each of the tests and how they progress is thoroughly expressed in the help file of the application.
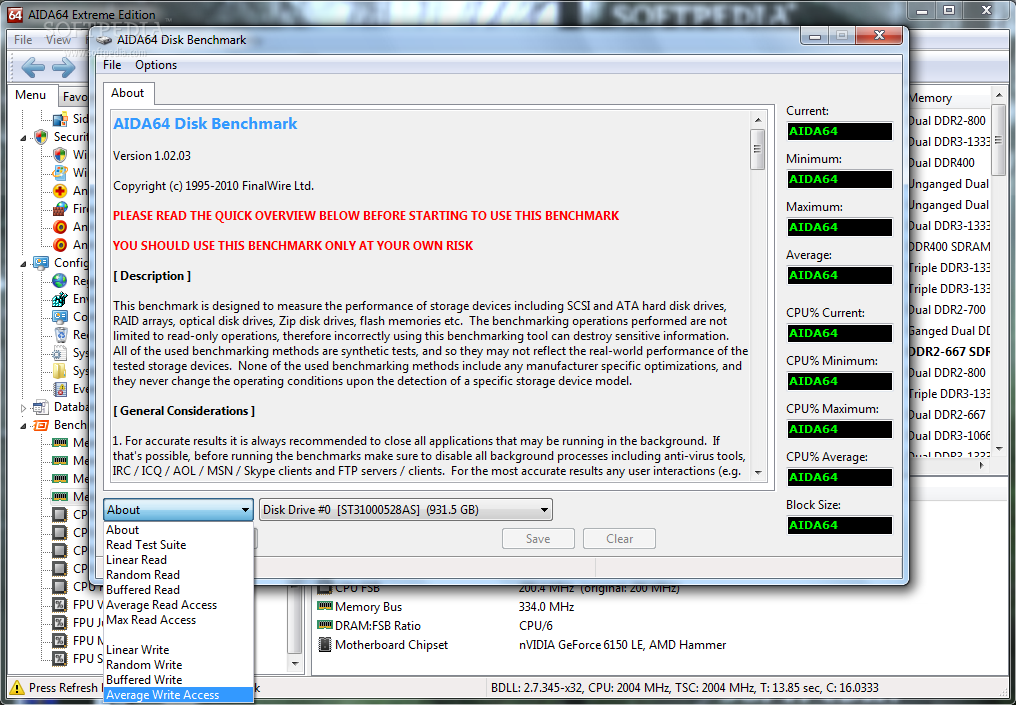
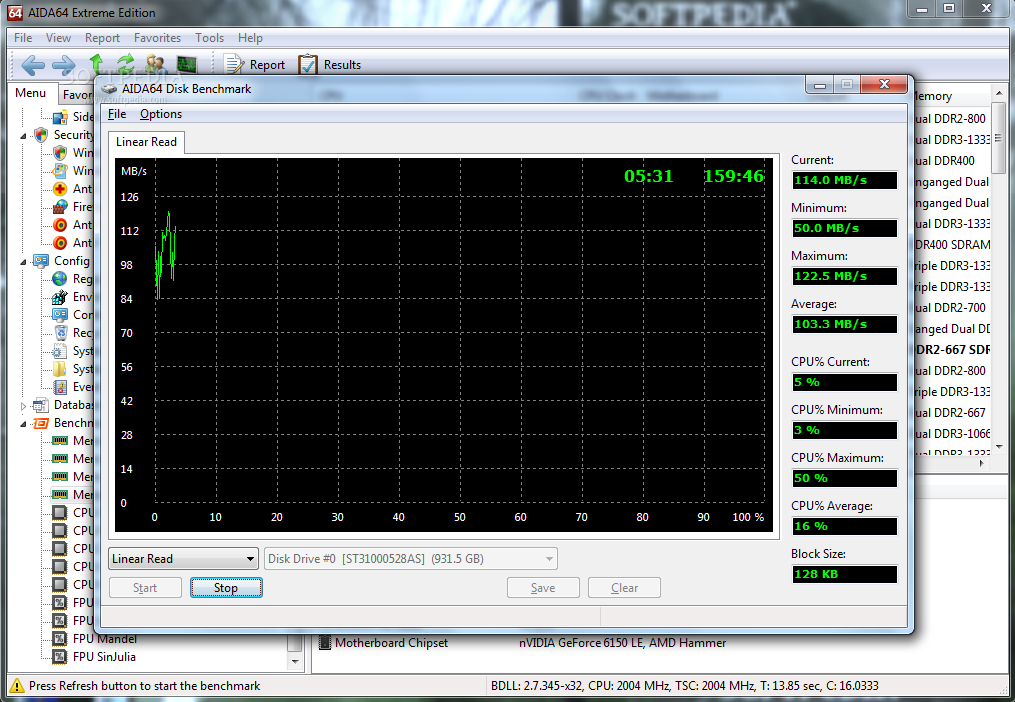
Further testing present in the program covers disk benchmarking, to show the performance of storage devices. Multiple assessment options are provided for devices including SCSI and ATA HDDs, RAID arrays, optical drives, ZIP drives or flash memories. These are not restricted to read-only operations and the developer warns on the incorrect usage of the benchmarks leading to destruction of sensitive data.
As such, write tests are not available by default in the application and have to be enabled from Options menu. A number of 10 benchmarks (both read and write) are at your disposal in the lower part of the AIDA64 Disk Benchmark screen and include linear read/write, random read/write, buffered read/write, average read/write access and maximum read access.
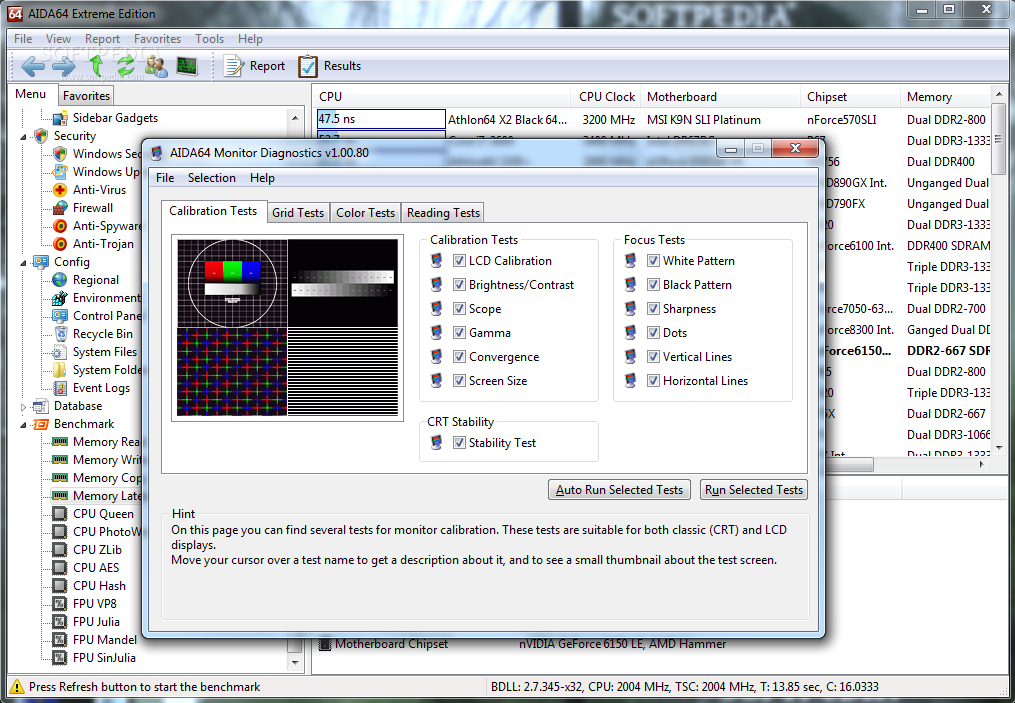
Monitor diagnostics are also present in the suite, allowing you to run calibration tests, grid tests, color tests and reading tests. Just like in the case of disk performance assessment all of them are wrapped up in a screen of their own. They can be run even by the average user as each comes with a hint on their purpose.
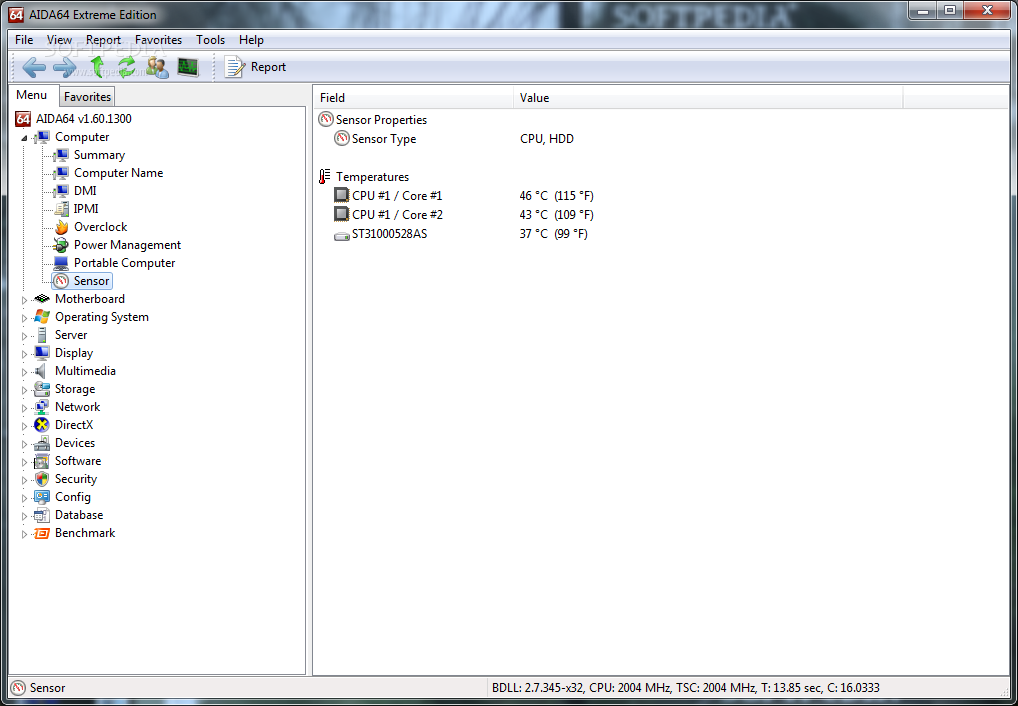
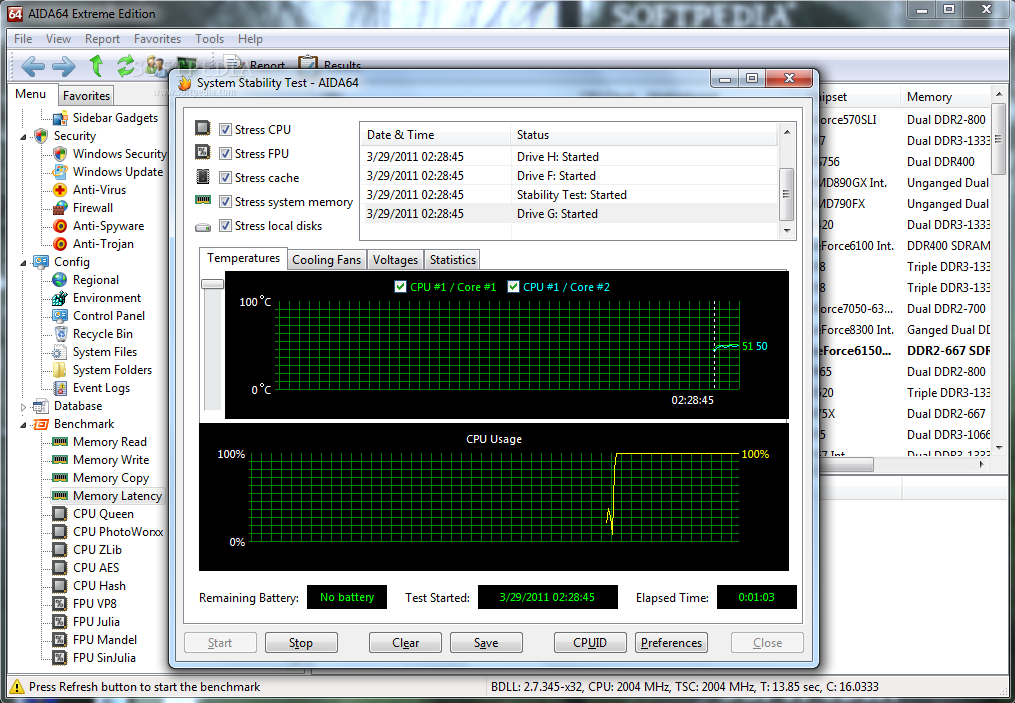
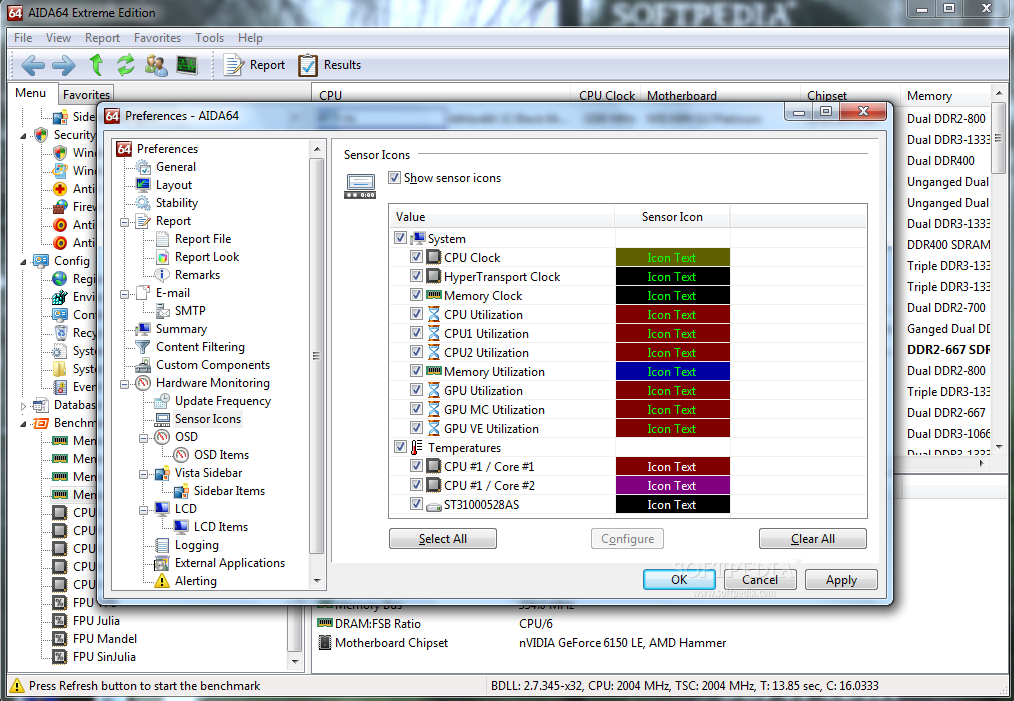
Although you can evaluate each component individually, AIDA64 reserves a special assessment procedure for rooting out possible stability or cooling problems in the system. System Stability Test can engage all major components of the system (CPU, graphics, RAM and local disks) together or separately, to give you an easy way to pinpoint the problem. As the test progresses you are able to view statistics for cooling fans, voltages and temperatures.
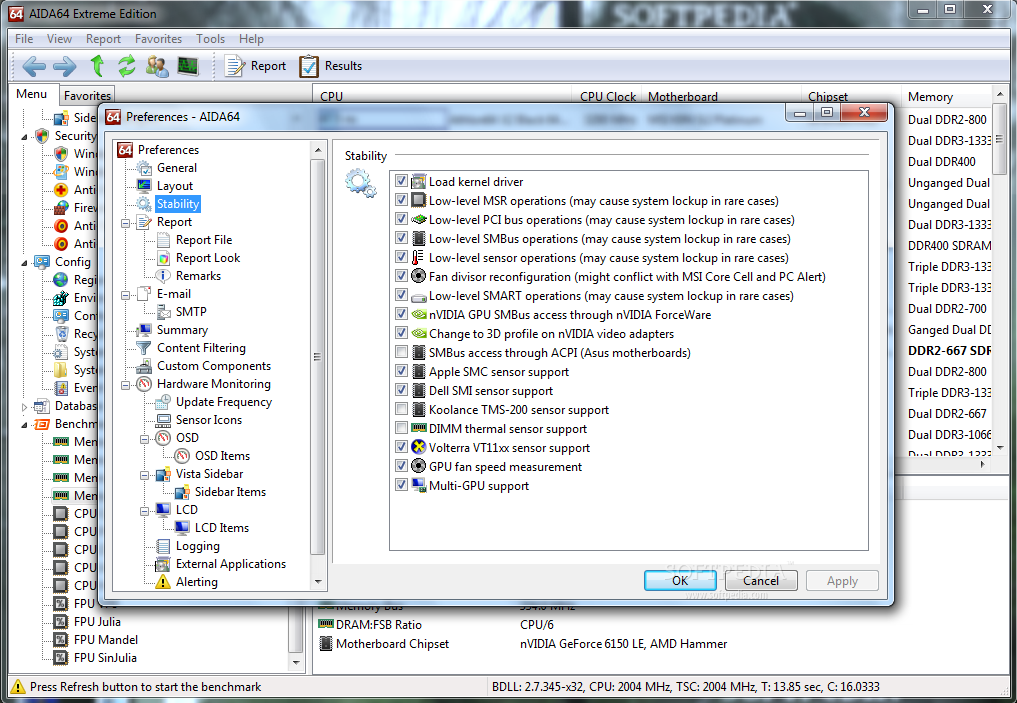
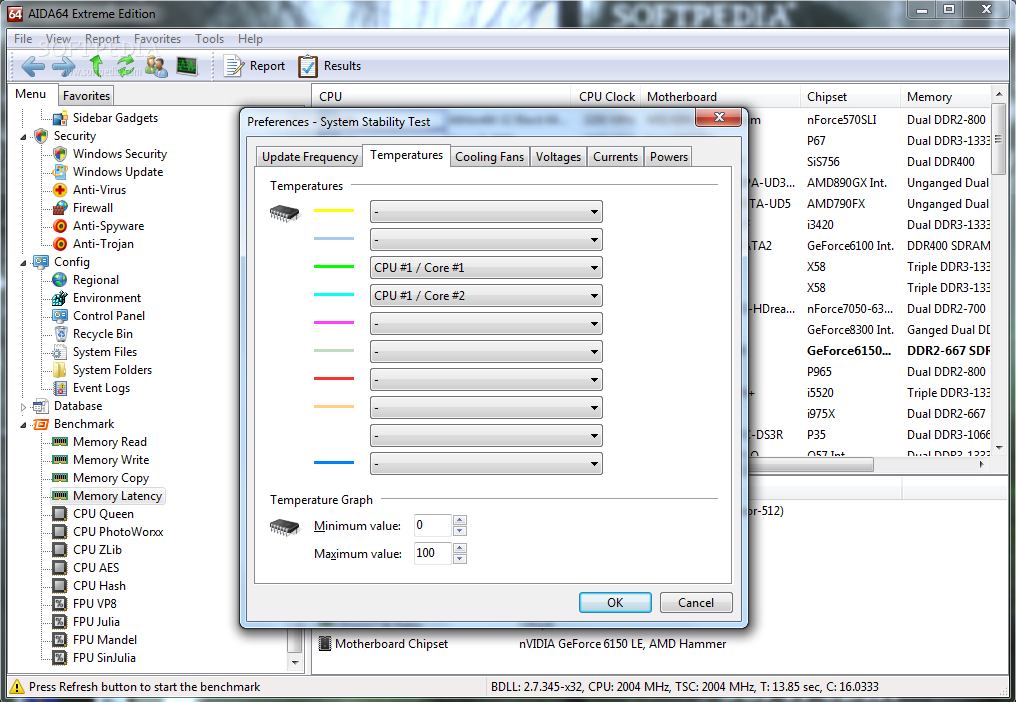
Software component of the system has not been left aside and users can view a sheet of all running processes as well as the entries starting with Windows. Also, you are given a clean view at the configuration of the system. It is a reliable tool when overclocking as it can provide hardware error diagnostics and stress testing for the major hardware pieces in order to benchmark performance and stability. You can configure it to alert when it records extreme temperatures for the CPU and hard disk drives. Additionally, you control the low-level hardware detection modules of the application and get to tweak them in order to make AIDA64 work properly. It would be nice to have a “start” button for proceeding with the synthetic tests in the menu instead of pushing the refresh key. Also, we noticed that there is no advanced memory diagnostic tool available, which would be a nice addition to the collection. The benchmarks in the suite are able to set your system in a comparison chart that comprises the most diverse set of configurations. Also, there is system stability evaluation as well as disk and memory benchmarking. All this make from it an asset for overclockers but average users can also put it to good use and learn about the underpinnings of their computer components.
The Good
The Bad
The Truth