14 DAY TRIAL //
 With the continuous evolution in both software and hardware, many users are looking for the best products that work well together an yield top-grade performance. Once all the pieces are in place, the only thing that's left to do is to assess their functioning, to see if any on them supports and needs any improvements. This task is to be carried out by dedicated software that can benchmark the individual parts and the system as a whole, grading several operational aspects to help you know exactly how your operating environment is performing. However, you may not always need that kind of tools, as a monitoring application will give you a general idea about how your PC is doing, by analyzing the real time usage of the most important components.
The monitoring of system resources is a job for which you can use the Windows Task Manager that shows you in the Performance tab some details you may be after, by employing simple percentages and graphs. Furthermore, Vista users are blessed with the Resource Monitor, a tool that is bent on telling you everything about everything. Well, actually it's ''only'' about the current status of your processor, disk, network and memory. Now, if you think the first is too scarce in information, the second shows you almost all but not quite what you're after, and above all that you want a simple interface displaying only the data you need, then it's time to get a special software.
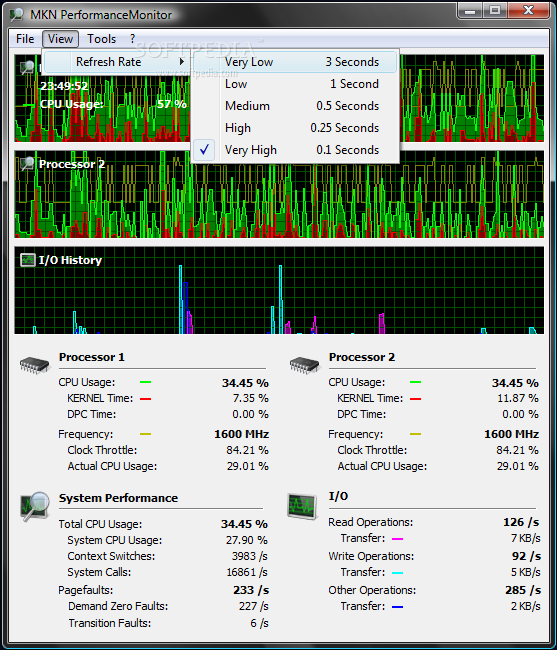
This kind of applications are easy to find and many are free, so it's only a matter of personal taste in opting for one or the other. MKN PerformanceMonitor is such a tool that may be of interest to you, because it seems to have what it takes to fit your bill: it gives you real time system info and is rather cheap, for it makes you spend under 2 MB of RAM and a few percents of CPU usage. It is also easy to install and use, as you don't need to configure anything more than the refresh rate.
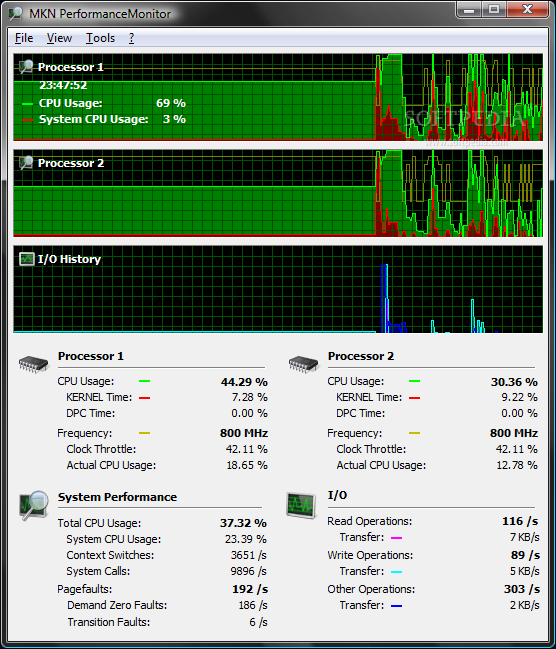
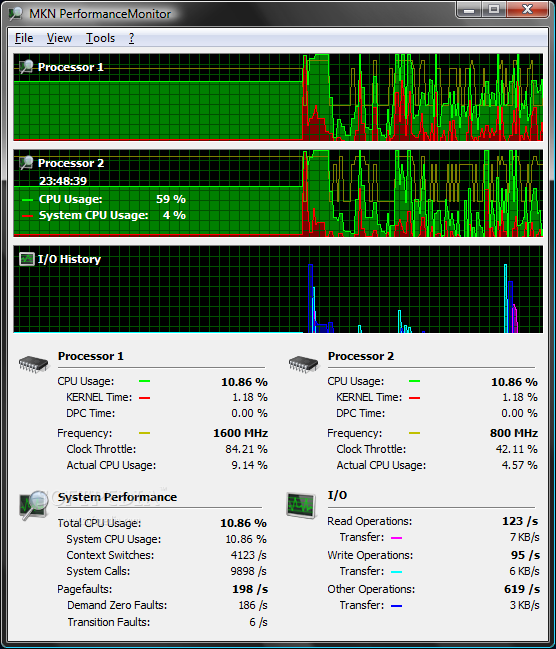
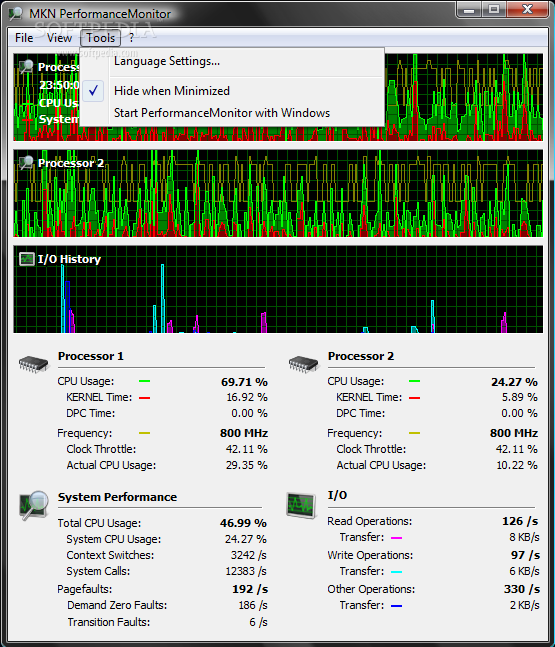
When you run the software, you'll come across a simple interface, with no tabs and buttons, just the information you need, well structured under the live graphs showing the processor(s)' load and I/O history. The data columns comprise the data concerning the CPU or CPUs if it's the case, input/output activity and general system performance. You will immediately notice that it lacks any RAM or network monitoring features, and this is due to the fact that the tool is focused mostly on the computer's processor operation.
At a closer look, you'll notice the factors tracked by MKN PerformanceMonitor, and they are quite a few. Besides the above mentioned CPU usage indicators, this application keeps tabs on how much time is used for the system code execution in KERNEL mode and to complete the Deferred Procedure Calls (DPC). If the numbers for the DPC time are high, you might want to check your device drivers and inspect the hardware components, as there could be a problem. This utility will tell you the current frequency at which each processor is running, as well, and it takes into account the clock throttle with the actual CPU usage.
Other parameters observed by the application are related to the system performance as a whole, but still a great deal of attention is paid to the processor operation. Consequently, you can view the current value of the context switches per second. This factor will tell you exactly how many threads fight to get some CPU time and the higher the value displayed is, the lower the system capabilities become, so it's best to keep an eye out for this variable.
Yet another aspect tracked by MKN PerformanceMonitor is the number of calls made into the kernel by the running programs. This specific indicator can give you a pretty good idea about the overall activity of your operating environment.
The Page faults factor is aiming at pretty much the same thing as the previously mentioned indicator. If the amount per second reaches high values, it's not OK, for this means that the memory that is in the page file is being accessed by an application, but it cannot be allocated. In this case, the page fault handler can either dismiss the request and Windows will show us an error message, or can allocate a physical page that will act as a substitute for the virtual memory called for in the first place.
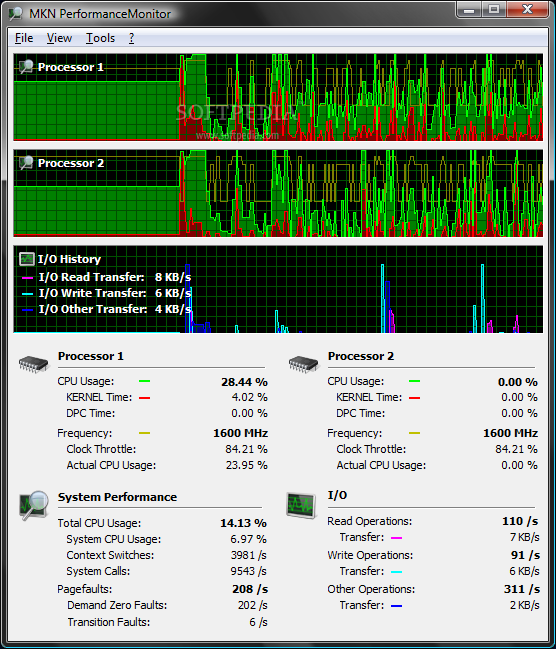
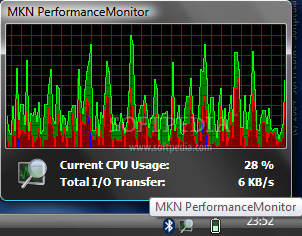
What makes for a quite useful set of parameters tracked by MKN PerformanceMonitor is the I/O module that is dedicated to the monitoring of input/output operations. Thus, you can see the disk read and write live stats in both numerical and graphical form for this indicator. It's also worth mentioning here that the diagrams displayed in the main window of the application have an interested functionality that you will come across when hovering the mouse cursor over them, whether the focus is on the utility or not. Then, you will be able to see some additional details about CPU usage and I/O transfers. This is also the case of the system tray icon that will show you the percentage for the current processor usage, as well as the total amount of input/output transfers in kilobytes per second.
The Good
The Bad
The software's interface, which is no more than average and, at least in Vista, would simply look dull if it weren't for the animated activity charts, is also considered a downside.
The Truth
Here are some snapshots of the application in action: