.NET profiler that can help users detect spikes and other issues within various .NET Framework applications in a convenient manner. #.NET profiler #Performance profiler #Memory usage profiler #Profiler #Memory usage #Performance
If you work as a software developer, you might understand that performing your daily tasks or creating high-quality projects can be a tedious, if not impossible activity, without an appropriate set of tools.
JetBrains dotTrace is a .NET performance profiler that lets you analyze various .NET applications in order to detect performance bottlenecks and analyze issues efficiently.
This program comes with a stylish, user-friendly interface that packs several functions, which are neatly organized throughout the main window and can be accessed without significant efforts.
More so, a collection of video tutorials and helpful tips is provided to you, but your computer needs to be connected to the Internet so that you can access it accordingly.
JetBrains dotTrace lets you detect performance spikes or bottlenecks in a broad range of .NET applications. Among the supported ones you can find standalone, WinRT, Silverlight, WebDev, IIS, IIS Express, Windows Service and .NET Process.
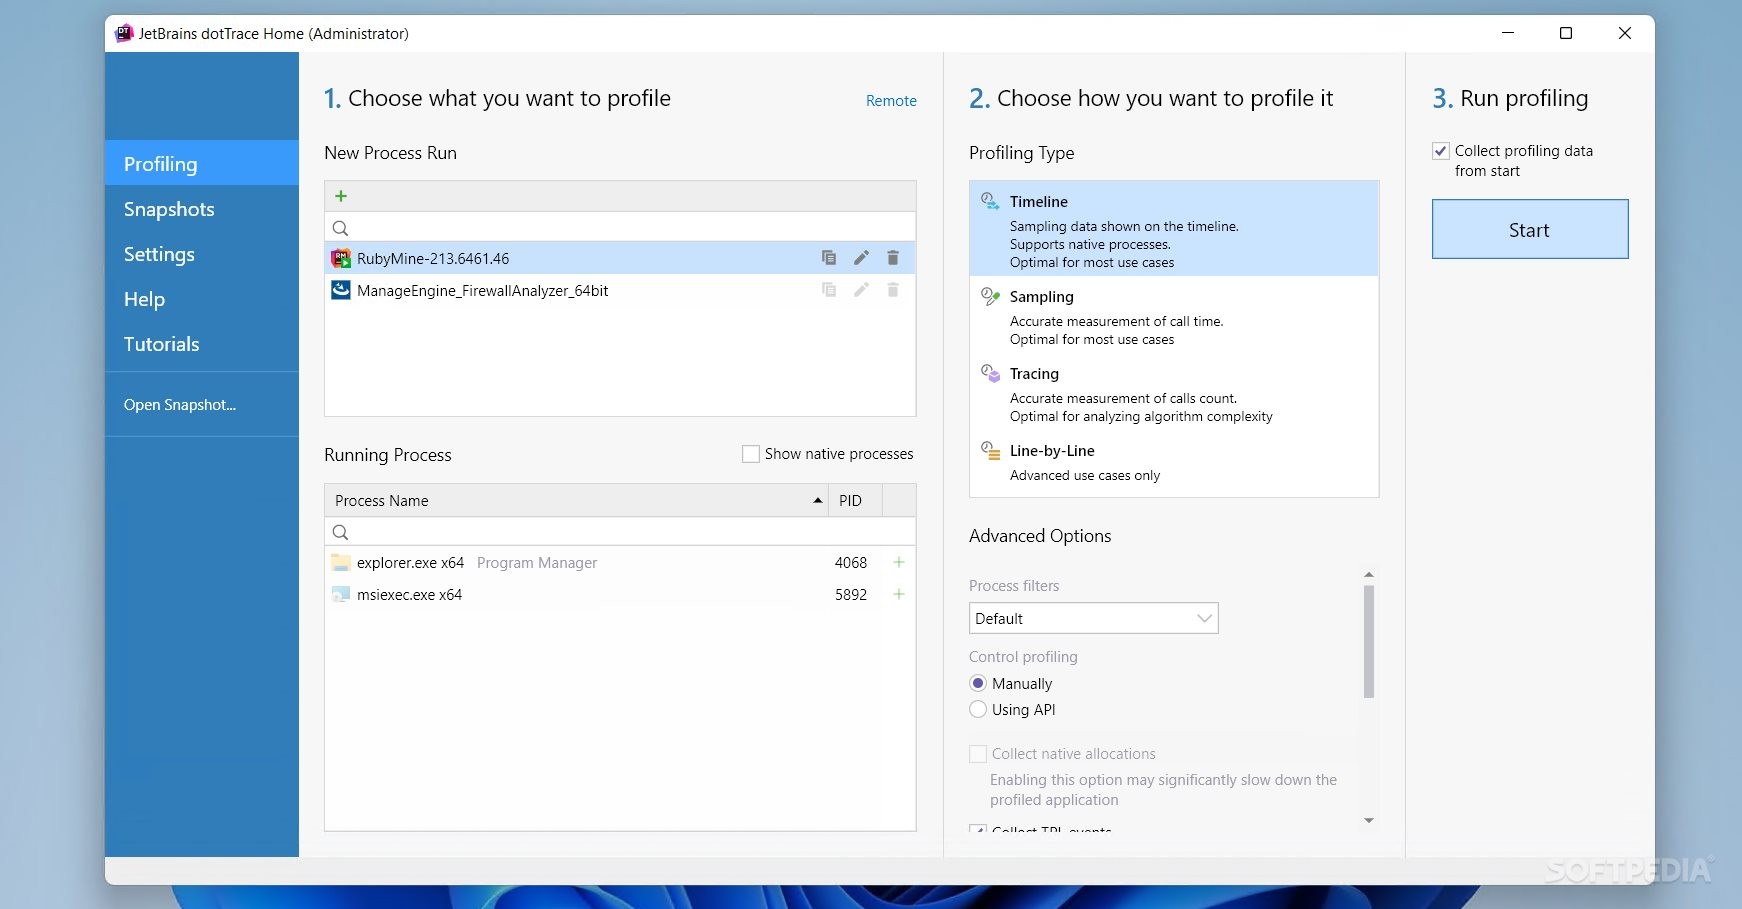
Profiling an app can be done differently, according to the type you have selected. Mainly, you need to specify a corresponding application, choose a profiling type from the list and hit the Run button. More so, it is possible to attach to a process by selecting it from the list under the application types.
It is also possible to perform a remote connection by simply accessing the Remote category, copying the dotTrace Remote Agent to the target computer and launching it. After doing so, you need to provide the application with a valid URL by just typing it in the designated field and hitting the Connect button.
The Preferences menu lets you choose the default location for saving snapshots and toggle automatic snapshot deletion or set it to ask for confirmation whenever this action is about to be performed.
All things considered, JetBrains dotTrace is a reliable utility that lets you detect and analyze performance issues in your .NET applications. It supports a wide variety of application types, comes with a smooth user interface, packs a handful of well-organized functions and provides you with a set of tips and video tutorials.
JetBrains dotTrace 2024.1.1 Build 2024.1.1.65536
add to watchlist add to download basket send us an update REPORT- runs on:
-
Windows 11
Windows Server 2022
Windows Server 2019
Windows 10 32/64 bit - file size:
- 287 MB
- filename:
- dotTrace64.2024.1.1.exe
- main category:
- Programming
- developer:
- visit homepage
Zoom Client

Bitdefender Antivirus Free

7-Zip

ShareX

Windows Sandbox Launcher

Microsoft Teams

calibre

4k Video Downloader

IrfanView

paint.net

- 4k Video Downloader
- IrfanView
- paint.net
- Zoom Client
- Bitdefender Antivirus Free
- 7-Zip
- ShareX
- Windows Sandbox Launcher
- Microsoft Teams
- calibre