A user-friendly and compact program that helps you display and print any graph produced by DPlot or DPlot Jr, as well as copy the image to the clipboard #Graph viewer #DPlot graph #Print graph #Graph #Viewer #View
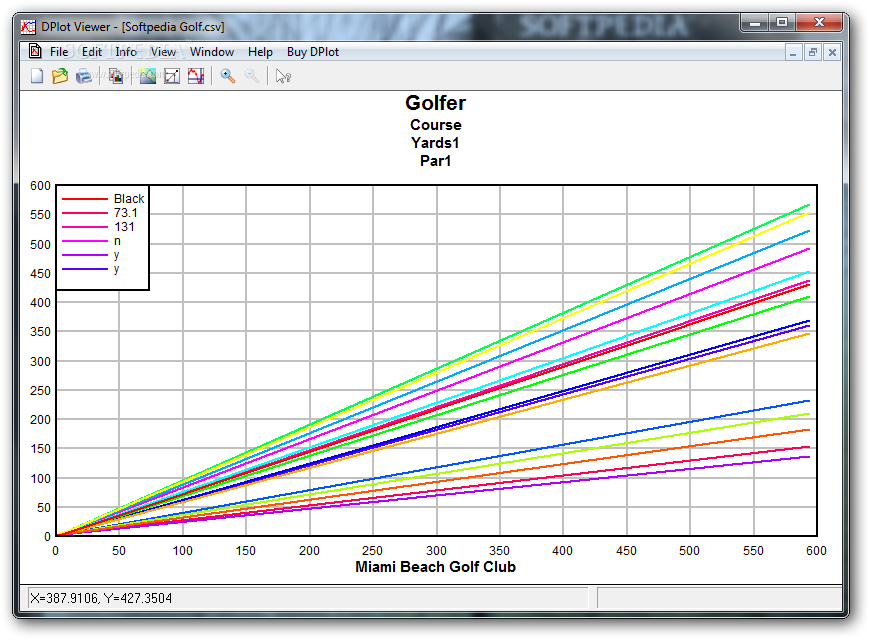
DPlot Viewer is a compact Windows application built specifically for helping you open and access graphs produced by DPlot or DPlot Jr, which are electronic plotters used by programmers for generating graphs that display the graphical output of their own utilities.
The tool offers quick access to a set of well-organized functions that enables you to manipulate graph data. Files can be uploaded into the working environment using the built-in browse button or “drag and drop” operations.
DPlot Viewer comes packed with several dedicated parameters developed to help you print the graphs and copy the image to the clipboard for pasting it into other third-party tools.
What’s more, you can list the minimum and maximum amplitudes, display data values, zoom in or out, as well as carry out interpolation operations for finding the amplitude for the x value.
Other notable characteristics worth mentioning are represented by the possibility to resize the image that is copied to the clipboard, erase curves, list peak values or list peaks within a range, find baseline, check the number of points, as well as hide or reveal all curves.
During our testing we have noticed that DPlot Viewer carries out a task quickly and offers very good output results. It is quite friendly with system resources, so the overall performance of the computer is not hampered.
All things considered, DPlot Viewer proves to be a handy application that can be used for developers who want to distribute DPlot graphs to others. The intuitive layout makes it an ideal tool for rookies and professionals alike.
DPlot Viewer 2.3.5.3
add to watchlist add to download basket send us an update REPORT- runs on:
- Windows All
- file size:
- 9.7 MB
- filename:
- dplotviewer_setup.exe
- main category:
- Multimedia
- developer:
- visit homepage
calibre

Zoom Client

Windows Sandbox Launcher

ShareX

Bitdefender Antivirus Free

4k Video Downloader

Microsoft Teams

Context Menu Manager

IrfanView

7-Zip

- Context Menu Manager
- IrfanView
- 7-Zip
- calibre
- Zoom Client
- Windows Sandbox Launcher
- ShareX
- Bitdefender Antivirus Free
- 4k Video Downloader
- Microsoft Teams