Designed for both students and teachers, this application enables them to quickly calculate math expressions and plot various graphs #Plot graph #Analyze graph #Polar coordinates #Plot #Graph #Asymptote
Graph Plotter is a practical and reliable utility designed to plot and analyze math functions and expressions effortlessly.
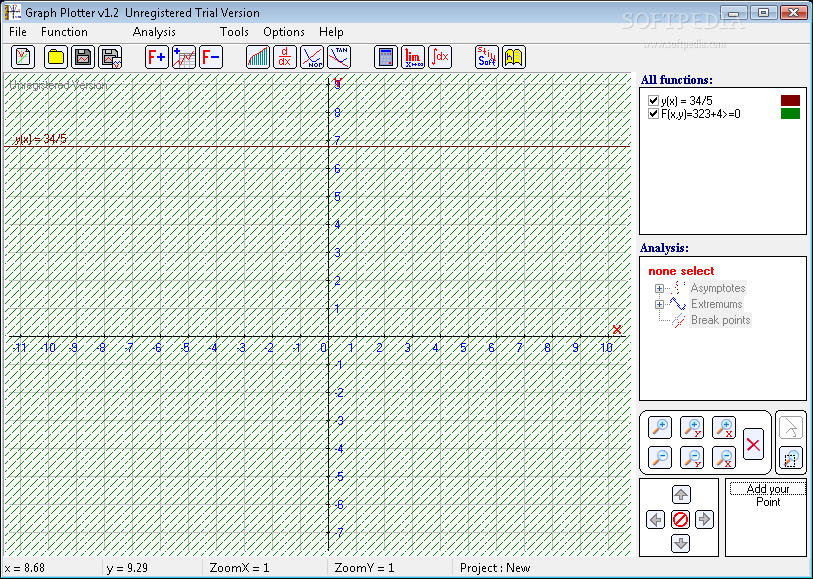
The application comes with an intuitive interface where all the menus are well organized on the upper side, so it can be easily used by professionals and beginners alike.
With the help of Graph Plotter you have the possibility to plot various graphs, use trigonometrical and hyperbolic functions and constants, calculate and draw normal and tangent lines to a function at a given point, as well as to save the graphs to BMP or JPG format.
On the right panel of the application you are able to view all the functions used to generate graphs, the coordinates of your cursor and the run-time analysis of the function.
Basically, Graph Plotter is easy-to-use and does not require advanced math knowledge. All you have to know is how variables are preceded by functions and how to set the variables so you can calculate math expressions and generate graphs.
The application enables you to plot and calculate area integrals between two curves by selecting the function you want, specify the vertical limits of area then generate the graph.
Also, by using Graph Plotter you have the possibility to calculate numerical expressions, perform computation of limits of functions as the 'x' variable approaches plus or minus infinity, as well as to calculate integrals.
The application runs without over-blocking, slowing the PC down or conflicting with other software installed on your computer. Thanks to its simple and intuitive layout, Graph Plotter should please all types of users when it comes to automatically generate graphs based on the specified values, calculate math expressions and learn how functions and operators such as tanh, cosh, acos or sin work.
Graph Plotter 1.2.3
add to watchlist add to download basket send us an update REPORT- runs on:
- Windows All
- file size:
- 1.7 MB
- filename:
- graphplotter.zip
- main category:
- Science / CAD
- developer:
- visit homepage
Windows Sandbox Launcher

calibre

Context Menu Manager

ShareX

Zoom Client

IrfanView

4k Video Downloader

Bitdefender Antivirus Free

7-Zip

Microsoft Teams

- Bitdefender Antivirus Free
- 7-Zip
- Microsoft Teams
- Windows Sandbox Launcher
- calibre
- Context Menu Manager
- ShareX
- Zoom Client
- IrfanView
- 4k Video Downloader