Software solution that enables you to calculate multiple indices and generate graphs in order to analyze a set of information, data can be analyzed in an organized in a tabular format #Statistical analysis toolbox #Generate histogram #Calculate standard deviation #Stastics #Analyze #Analysis
There are many applications and programs on the Internet that you could use in order to manage your files. One of them is Data Analysis.
It's a useful software solution that enables you to calculate multiple indices and generate graphs in order to analyze a set of information, data can be analyzed in an organized in a tabular format.
The application takes almost no time to install and it doesn't come with a complicated setup that you would need to complete before you can actually use it. It sports a clean and simple user interface with a neat layout that gives you access to multiple sections.
Data Analysis is a useful software solution that enables you to calculate multiple indices and generate graphs in order to analyze a set of information, data can be analyzed in an organized in a tabular format.
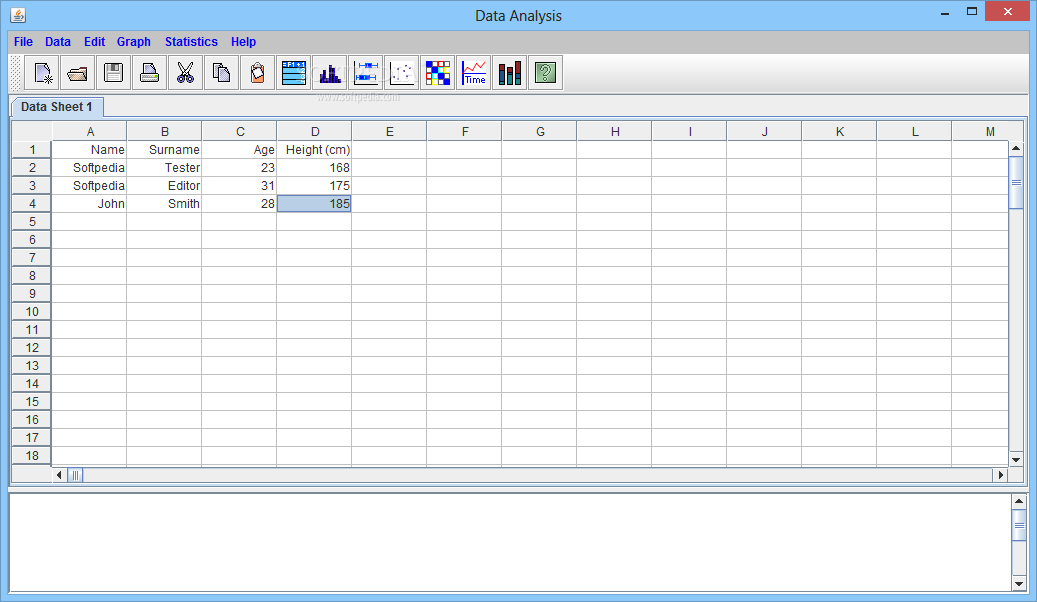
It allows you to analyze univaritate and bivariate data in graphical and numeric displays. A Data Analysis data sheet is like a spreadsheet environment with statistics related functionality. It lets you modify or edit a pre-loaded data sets.
You can use multiple options including cut, copy, paste, fill down, sets of digits, column name, and column formula. Options for graphical display include those for univariate and bivariate data display, statistical plots, and frequency tables.
You can view summary statistics for the columns of an active data sheet.
The following calculations are given for each column: n (number of values in the column), Mean (arithmetic average), Minimum (smallest value), Q1 (first quartile), Median (middle value of ordered list), Q3 (third quartile), Maximum (largest value), Sample Standard Deviation (a measure of spread), Sample Variance (the square of the standard deviation).
Data Analysis is a useful software solution that enables you to calculate multiple indices and generate graphs in order to analyze a set of information, data can be analyzed in an organized in a tabular format.
Data Analysis 1.1
add to watchlist add to download basket send us an update REPORT- runs on:
- Windows All
- file size:
- 4 KB
- main category:
- Science / CAD
- developer:
- visit homepage
Microsoft Teams

7-Zip

ShareX

calibre

Windows Sandbox Launcher

Bitdefender Antivirus Free

IrfanView

4k Video Downloader

Context Menu Manager

Zoom Client

- 4k Video Downloader
- Context Menu Manager
- Zoom Client
- Microsoft Teams
- 7-Zip
- ShareX
- calibre
- Windows Sandbox Launcher
- Bitdefender Antivirus Free
- IrfanView