SPT correlation with geotechnical soil properties #SPT correlation #SPT interpretation #Soil analyzer #Correlation #Correlate #Soil
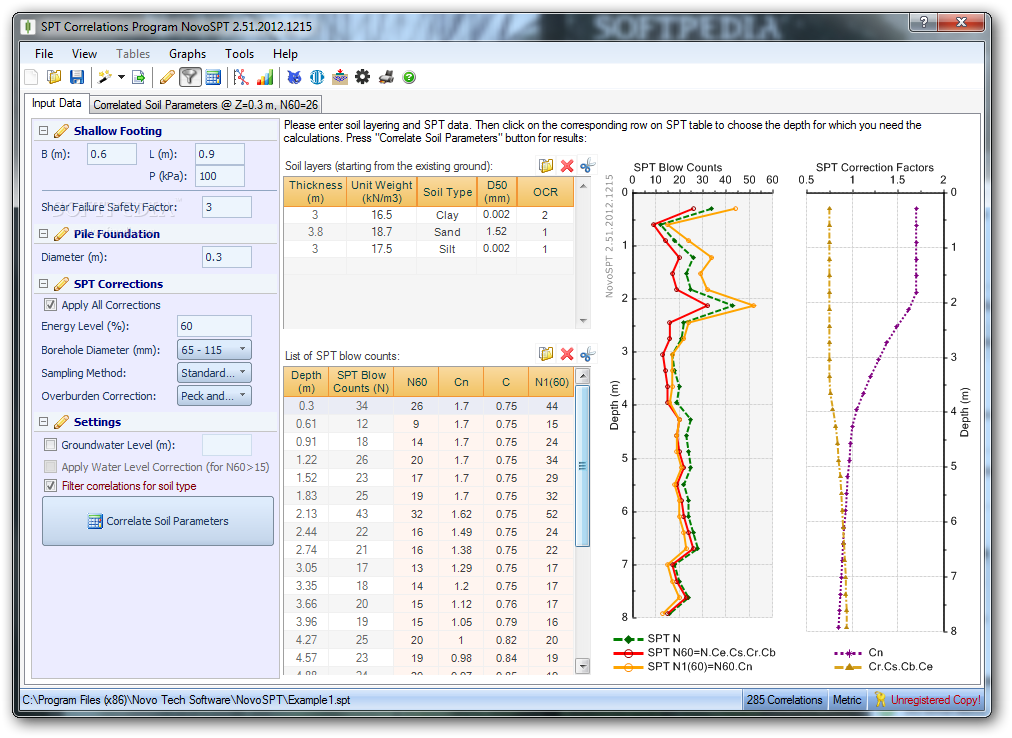
NovoSPT (SPT Correlation Program) is a useful application used for interpretation of Standard Penetration Test (SPT/ DCPT) and correlating blow counts to soil properties.
NovoSPT (SPT Correlation Program) is based on more than 100 equations and methods extracted from 30 geotechnical books and papers.
All charts can be separately printed, saved as text file, MS Excel file and even exported to graphic formats like JPG, BMP, TIFF, etc.
Since bearing capacity and settlement of shallow foundation and piles are also incorporated into this program, user may enter as many SPT numbers in depth as necessary. NovoSPT (SPT Correlation Program) will calculate the average N60 below the foundation according to this data.
Totally more than 100 formulae and methods are implemented from 30 papers and reference books. One of the features of NovoSPT (SPT Correlation Program) is plotting all the results and correlated values for a specific soil parameter in one graph to facilitate comparison and choice of the best estimated value for that parameter.
The powerful report builder in NovoSPT (SPT Correlation Program) summarizes all correlated results in a good-looking, printable report in form of tables and graphs. See the complete list of correlated soil parameters based on Standard Penetration Test (SPT) in NovoSPT (SPT Correlation Program).
The new innovative "Cross Correlation with Depth" feature enables user to plot the variation of a specific soil parameter along depth of borehole, correlated based on some correlation methods to ease comparison of correlated values in depth.
System requirements
Limitations in the unregistered version
- 14 days trial
- Nag screen
NovoSPT (SPT Correlation Program) 2.77.2014.215
add to watchlist add to download basket send us an update REPORT- runs on:
-
Windows 8
Windows 7 32/64 bit
Windows Vista
Windows XP
Windows 2K - file size:
- 11.9 MB
- filename:
- NovoSPT.zip
- main category:
- Science / CAD
- developer:
- visit homepage
4k Video Downloader

ShareX

7-Zip

Bitdefender Antivirus Free

Context Menu Manager

IrfanView

calibre

Microsoft Teams

Windows Sandbox Launcher

Zoom Client

- Microsoft Teams
- Windows Sandbox Launcher
- Zoom Client
- 4k Video Downloader
- ShareX
- 7-Zip
- Bitdefender Antivirus Free
- Context Menu Manager
- IrfanView
- calibre