! important !
The site content update has been discontinued. Links may not work.Please click here to continue to OVO.CZ for fresh content.


I found this very nice forum at informedtrades.com. I hope they do not mind if I reprint part of their posts.
I. An Introduction to Range Bars
I am going to make an attempt to create a lesson on Range Bars to give back a little of what Informormedtrades.com has given to me. I hope this course is not a disapointment and can answer some questions that someone may have about the subject.
I will start here with the definition and where Range Bars Charting came from. Then every day I will contribute untile the course is completed,I promise not to draw this out and bore you all to death.
RANGE BARS (the definition): Range Bars sometimes called Momentum bars or Constant range bars. The bars look like a standard chart with an open, high, low, close and volume. The high-low range of each bar is constant. A new bar does not start until a price tick or pip is received that would exceed the fixed range of the current bar.
Characteristics of Range Bars:
1. Each bar is the same height because the range is constant.
2. The close of a bar is always at the high or low of the bar.
3. The open of a bar is always one tick or pip below or above the close of the preceding bar.
4. The time period covered by each bar varies since time is irrelevant to range bars.
5. All gaps are filled with inserted phantom bars.
RANGE BARS ( the creation ): Range Bars were created by Vicente M. Nicolellis Jr., a Brazilian broker and trader in 1995 (so range bars are a very new concept). During the 13 years he spent running a trading desk in Sao Paulo, where local markets tend to be volatile, he wrestled with the problem of how to handle this volatility and its variability. Finally he concluded that the most promising approach would be to eliminate time from the equation, and just concentrate on price action.
Other Links To Help You Learn About Range Bars
In addition to the lessons below in this thread, InformedTraders can try the following links to learn more about range bars:
TradingFX Forex Range Bars Point & Figure Currency Strength Index
Range bars | Trade2Win Forums
An Introduction to Range Bars | Fibonacci Trader
III. Advantages of Range Bar Charts, Part I
In the upcoming lessons we will take the advantages of range bars and create exaples on my charts to explain there benefits. I will be using Crude Oil Charts (CL) with a 10 to 20 range bar setting to display these examples.
Range Bar Chart advantages:
1. Smoothing out price action and eliminating market noise.
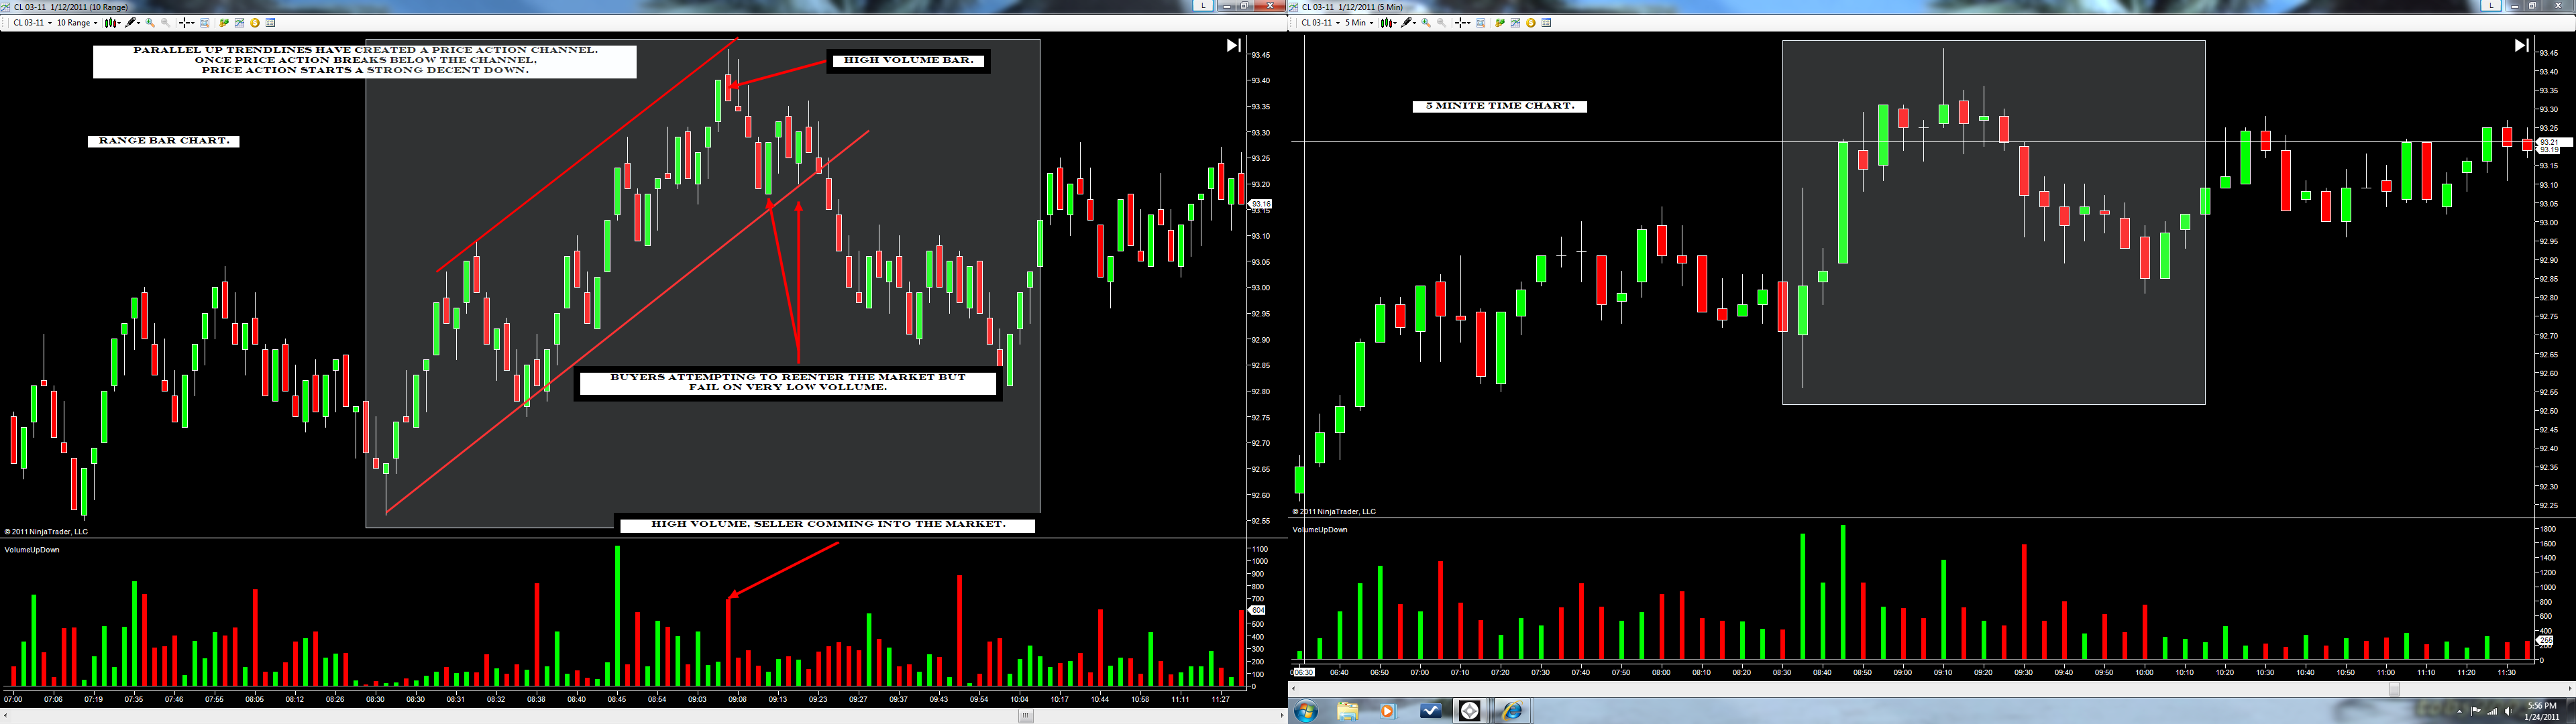
As you can see in the examples above the range bar chart to the left has smoothed out the price action eliminating most if not all the noise in the entire day. Now look at the time chart price action it is all over the place especially in the after noon hours.
Range bar charts smooth out and eliminate noise because that are purely based on price action and not on time . Time is irrelevant in range bars. When you put time in the equation you end up with the chart on the right (choppy market noise).
IV. Advantages of Range Bar Charts, Part II
In this Lesson we will continue to give examples of the advantages of Range Bars.
Range Bar Chart advantages:
2. Defining clear support levels.
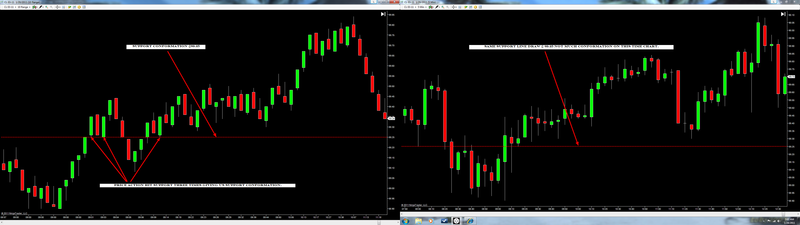
In the example of the range bar chart on the left we have clearly difined a support level @ 89.25 . Not only have we been given a support level but it has been confirmed at three different points in the price action making this a level of support that can be trusted and have a high probability of success to trade off of.
Notice the time chart to the right, this is the very same price action as the range bar chart to the left but the support is really unclear and you see an undecisive market.
Range Bar Chart advantage:
3. Defining clear resistance levels.

In the example of the range bar chart to the left we have clearly defined a resistance level @ 91.69 and it has again been confirmed and test three times before price action made its desent. As you can see this was a consoildation period notice how less bars were printed on the range bar chart than the time chart? This eliminates a lot of unnecessary noise and confusion. ( The highlighted price action in the range bar chart is the same highlighted price action in the time chart.)
If you liked the reading, you may continue in the original thread at informedtrades.com.