14 DAY TRIAL //
 Widgets and other information utilities are plentiful and diverse in both look and functionality. But if you already suffer from window clutter, or work on a PowerBook and are short on screen real estate, you need something that will take up as little space as possible and tell you everything you need to know.
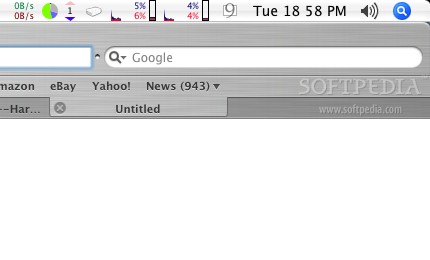
MenuMeters is one such utility that monitors the memory, CPU, disk and network activity of your Mac. The only real difference between this little monitor and others is that this one is a true MenuExtra which can be dragged around for reordering and dragged off the bar for removing, just like any other Apple item in the right half of the menubar. This is once again good news for those mobile users, who usually have several extra menu items enabled, because this little baby will not reorder your menubar on every login.
The CPU Meter This little menu meter will display the activity of the CPU. You can display the activity of both the user and the system as an average or choose to display each separate. If you happen to have more than one processor, you can opt to have each one show individually, or having them both averaged as one. You can choose to display the activity either as a percentage that indicates how much is being used, as a graph, as a thermometer or as any combination of the above. You can set the colors that will be used to indicate system, user and "nice" CPU loads.
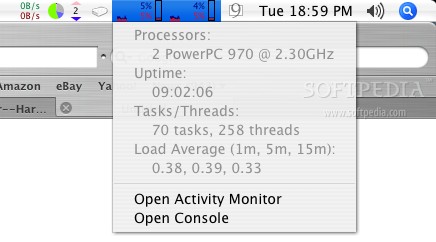
Clicking on the Menu Meter will bring up a menu in which you can see additional information such as the uptime; the number of tasks and the number of threads active; as well as an activity average history in the last minute, in the last five minutes and in the last fifteen minutes. Also from this menu you may open the Activity Monitor and the Console.
The Disk Activity Meter Here you can see the disk activity for local disks. The meter is hotplug aware, and will show activity on FireWire and USB disks the second they are mounted. Pageins (the reading of memory from disk) are color coded green and associated with the up arrow while Pageouts (the writing of memory to disk) are color coded red and associated with the down arrow. You have several ways of displaying the disk activity, from a hard drive icon with 2 little arrows on it to a PC case like display.
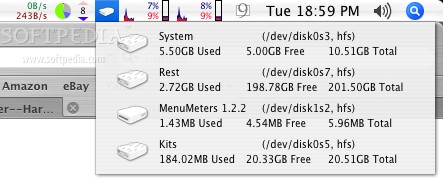
Clicking on this Menu meter will bring up a list of all local disk drives with their capacity, used and free space. You can set the behavior of the menu when selecting one of these to either open them or unmount/eject them.
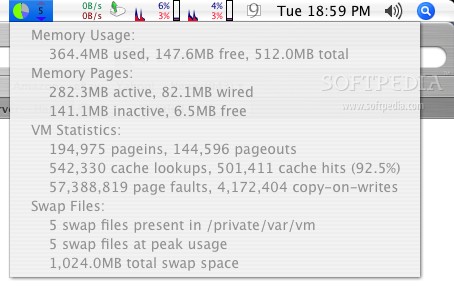
The Memory Meter This will let you keep a close eye on your memory usage. You can see the active, wired and inactive memory in several ways from pie-chart to thermometer, graph and plain old numbers. Should you wish it you can also opt to display the paging activity monitor that will tell the current number of pageins and pageouts.
Opening the menu will reveal the current memory usage, in terms of used and free; or active, wired, inactive and free pages. Also here you can see the virtual memory statistics such as the total number of pageins and pageouts, cache lookups and cache hits, page faults and copy-on-writes. Finally you can see the current number of swap files, the peak number of swap files and the total file size of those swap files.
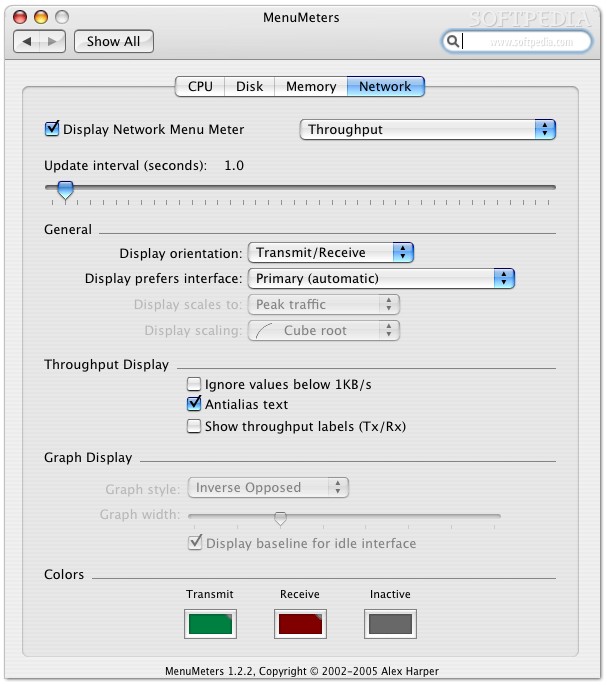
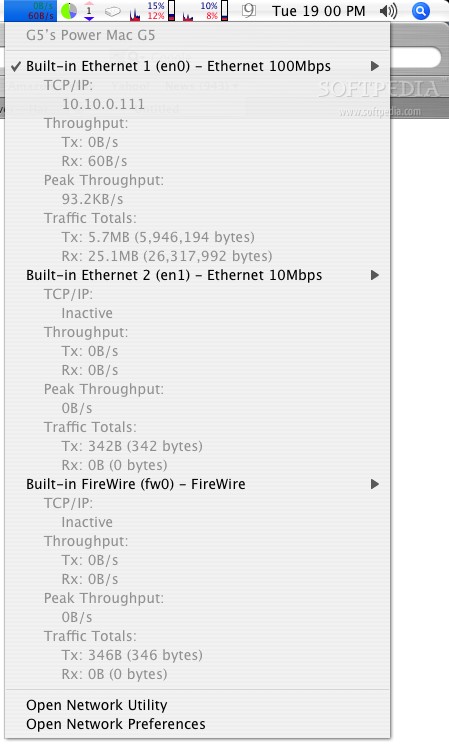
The Net Meter Here you can see your network throughput either as a number (representing bytes per second), graph or arrows or any combination of the above. For those with a powerful connection, you can choose to ignore values below 1KB/s and you can also change the stacking order of incoming and outgoing network activity. No matter how many network interfaces you might have up and running, you can only display one, but you can choose which. If you would like to see the rest of the interfaces just drop down the menu. Here you can see the IP of each interface, the current throughput as well as the peak and traffic totals. You can easily select the interface to be displayed in the menu meters via submenus and you can also quickly access Network Utility and Network Preferences.
The Good It displays a host of very handy information in a very compact space, it is highly customizable, and very, very simple to get up and going.
The Bad They do use a bit of a haxie, and the developer does inform you of this and warns you that if you have a problem with this, not to use them. On the other hand, there is virtually no permanent damage that these meters can cause, at worst, if they crash, they can hang the Finder, and the Finder just starts back up. Not to mention that such a crash is extremely rare. As a truly bad point, most of those meters are sure ugly and could really use a face lift.
The Truth Great for getting that information you need fast and easy, takes very little screen space and can be tweaked to your heart's desire. It could look a little better but then that's just grabbing at straws. Really good stuff, especially for PowerBook users.
Here are some screenshots to see what those meters look like, click to enlarge: