14 DAY TRIAL //
 We all use graphs on a daily basis. Some of us use them at school, others at work, and there are some people that work in science labs, using graphs for experimental purposes.
All of them need a way to quickly visualize the result of an experiment, the schedule for a day, or even to see the lesson learned in the chemistry class.
Graphs are mainly used for scientific purposes, because they are a good way to draw conclusions from experiments and share the result with other scientists. Graphs are also useful in mathematics, where they can be used to visualize functions, integrals and other operations.
Graphs can also be used for derivatives, Gauss sums, and many other calculations. gattMath was created in order to satisfy the need for a mathematical plotter that could create 2D and 3D plots in a matter of seconds, based on important mathematical functions that are widely known.
The Looks
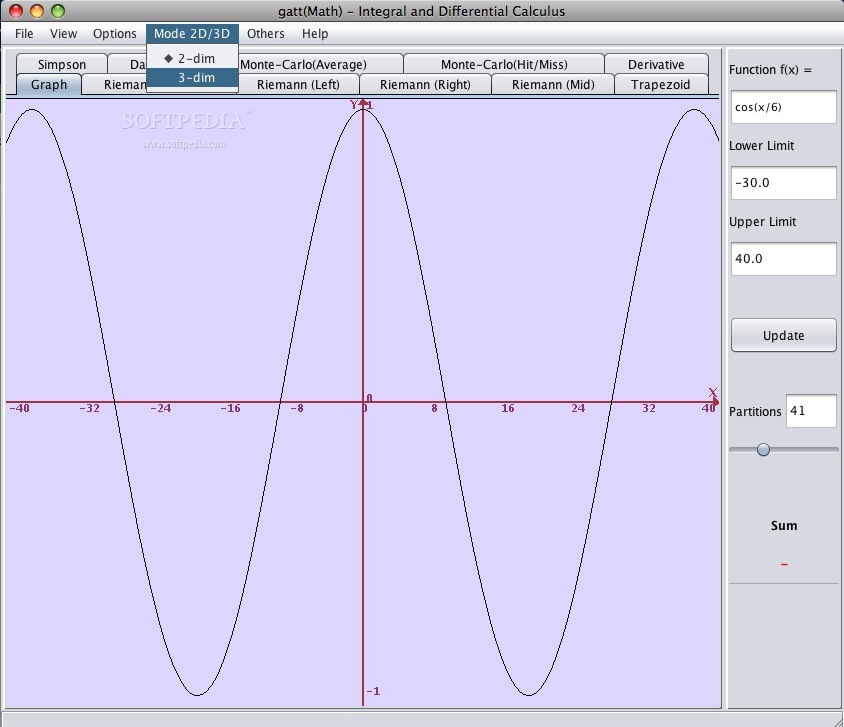
GattMath is created in the Java programming language, so it is multiplatform and has a pretty basic interface. In the middle of the screen, you have the main working window, containing all the plots, graphs and derivatives you may need.
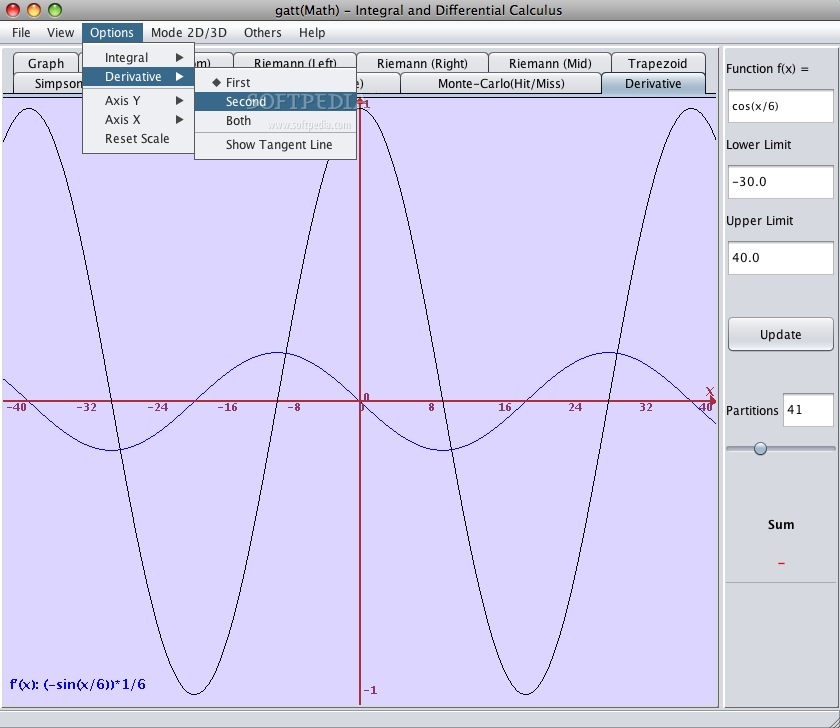
On the left side, a panel can be accessed, where you can make various changes to the plots. The upper panel is mainly used for view changing, customization and a quick change between the 2D and 3D mode.
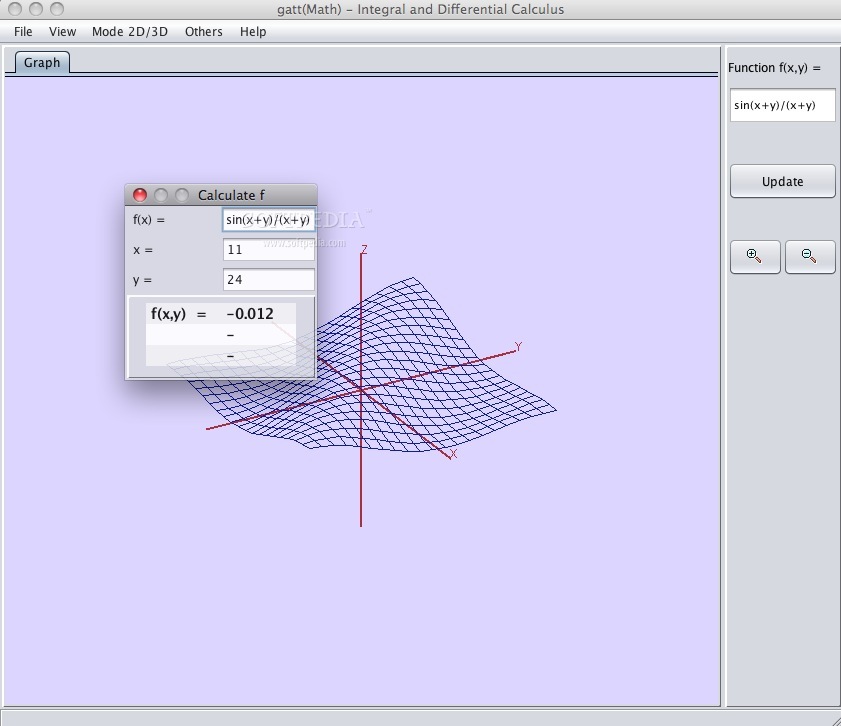
GattMath also contains an external calculator that allows you to make quick changes to the plots and get simulation results.
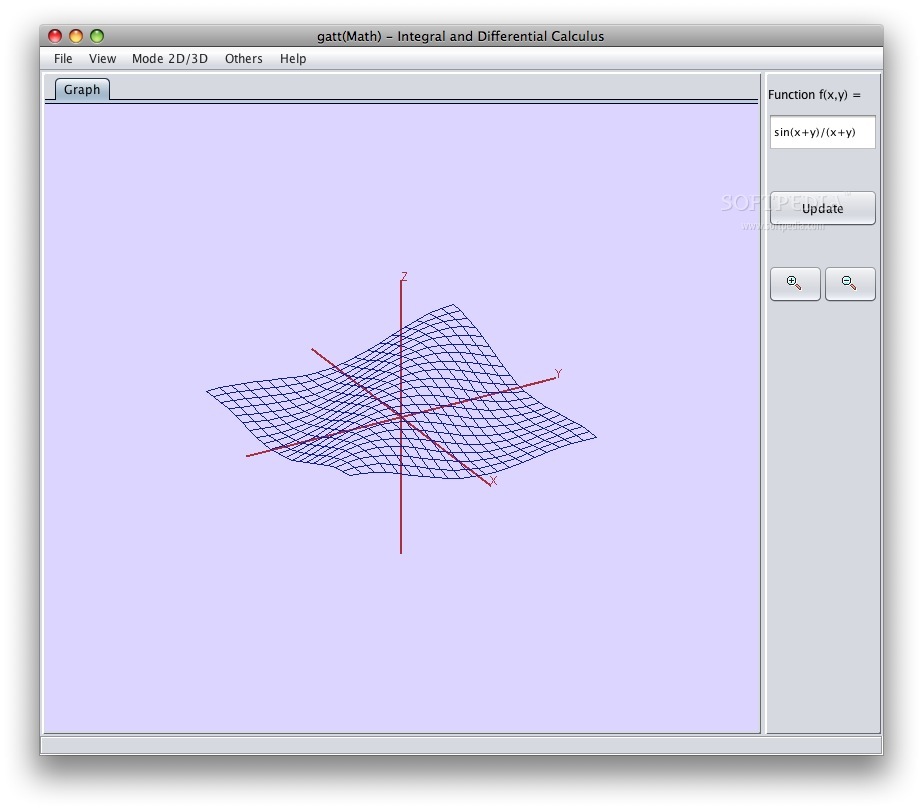
The 3D mode is surely one of the innovations brought by the software, because most of the math plotters only operate in the basic 2D mode. With the introduction of 3D, users can now visualize plots on a whole new scale, and see their integrals and derivatives on a real scale instead of a theoretic one.
The Works
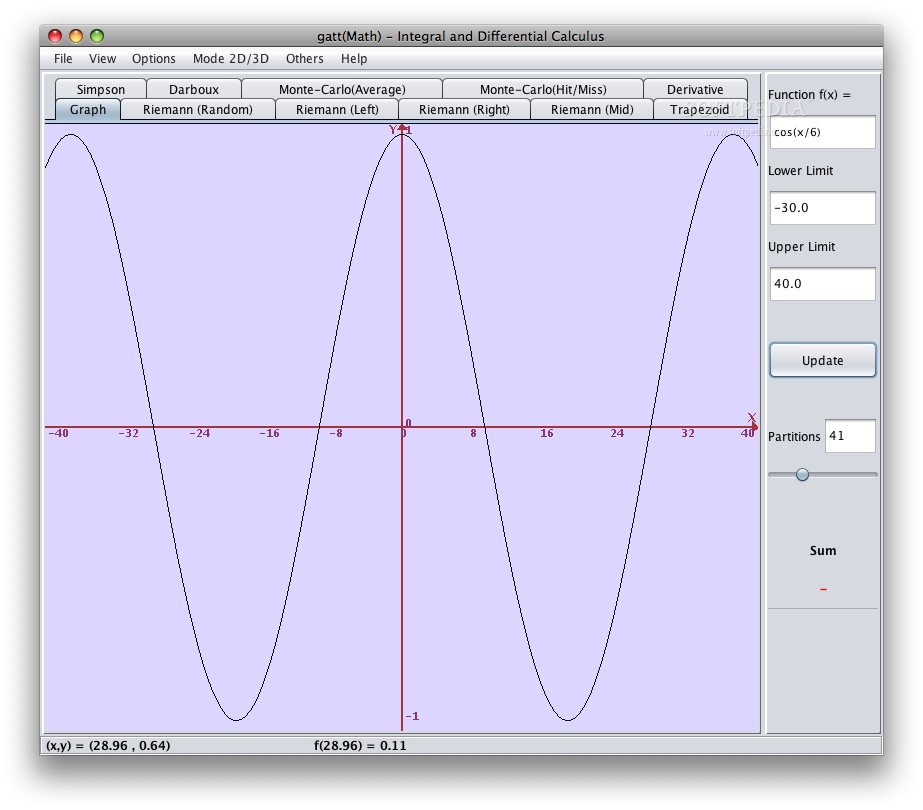
When starting GattMath, the first thing available to you is the graph creation module. This allows you to create a graph that will be used as base for the implementation of various integral theories.
You can insert any function and also choose the upper and lower limit for the graph. This part is very important because most of the upcoming changes rely on the basic implementation, so be careful when creating the first graph.
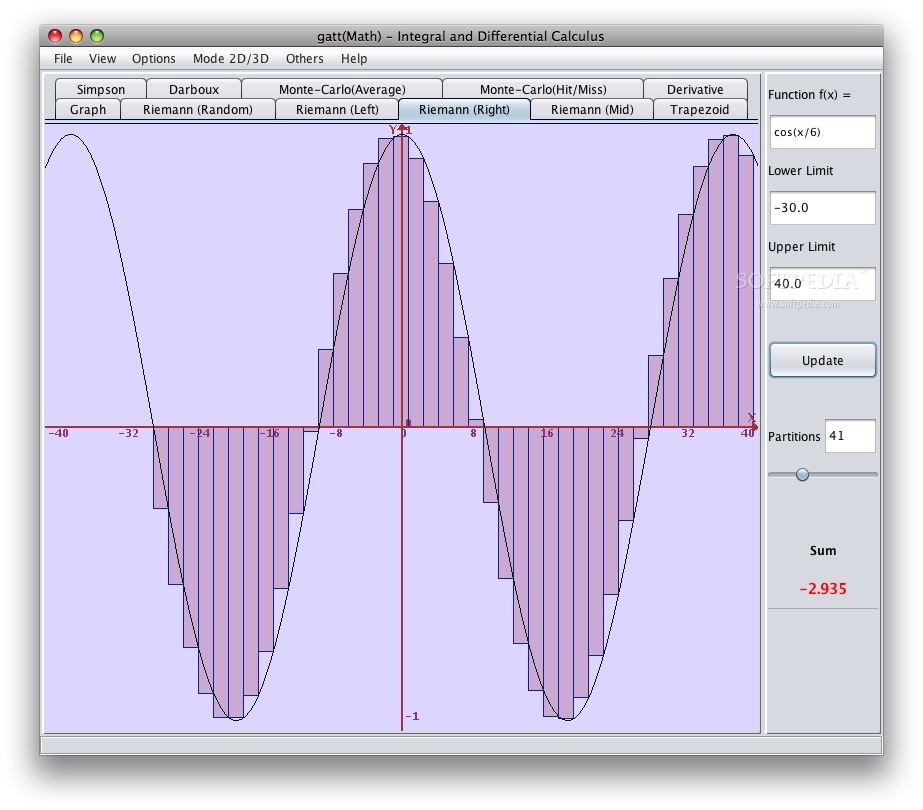
After creating and updating the graph, you can start visualizing some basic derivative implementations. The first one available is the Riemann sum. This sum can be viewed in 4 modes: a random mode, a middle mode, a left and also a right mode. The difference between these modes is that you can easily see the changes made to a specific calculation from various angles.
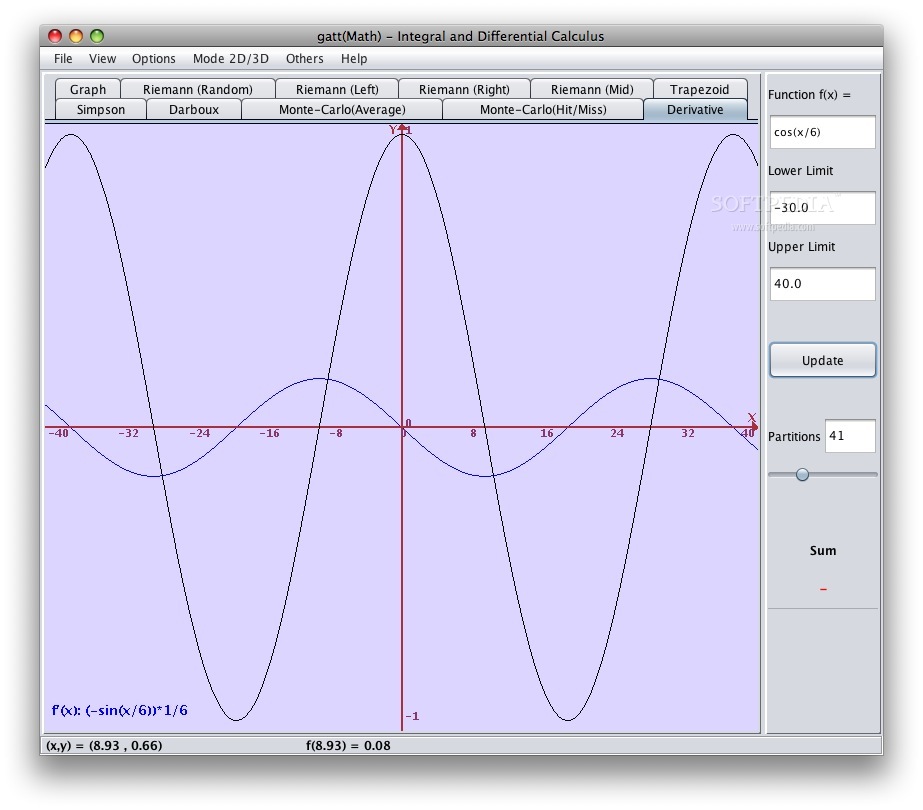
The other calculations that can be performed are the trapezoid calculation, the Simpson calculation, and the Darboux and Monte-Carlo calculations. Also, you have access to some derivative calculations.
In the 3D mode, you can only visualize the basic graph that you are currently working on. It would be nice to see a 3D implementation of the other calculations as well, but this is not available for the moment.
Another thing that will surely be useful is the scale reset option. This allows users to successfully revert the changes made to a plot and start off with a brand new one. A nice addition is the calculator, which allows you to preview function results and see how that would change your graph.
This calculator can be accessed from the upper panel, and it is a quick tool to see how much impact the new changes can actually make. It would be nice if, instead of a simple calculator, we could have the results presented in a 2D or, even better, in a 3D mode. Maybe this will be added in later versions.
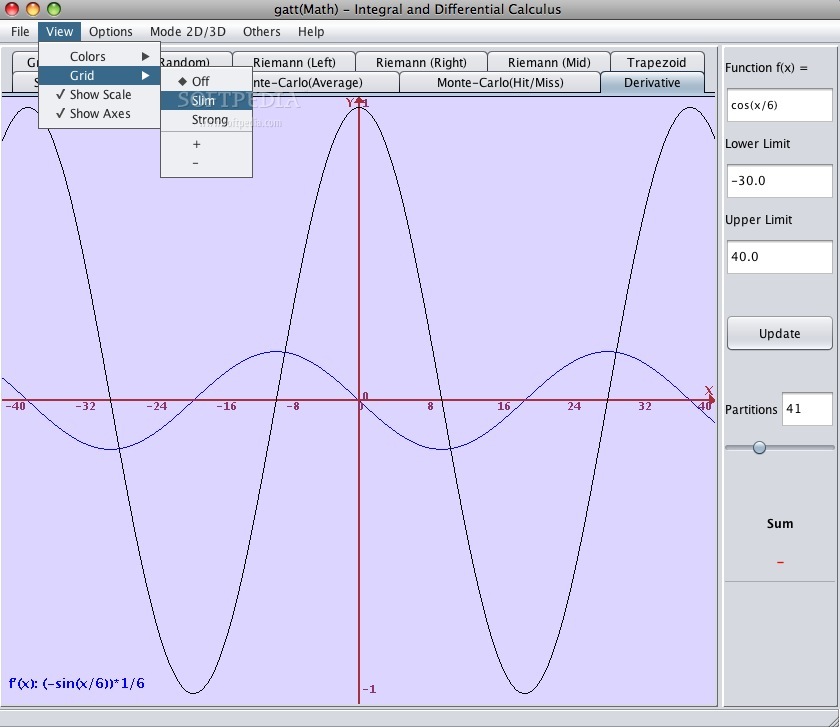
GattMath offers some specific functions for integrals and derivatives. Integrals can be plotted numerically, while derivatives can be shown all at a glance, or with a tangent line. The result is depending on the number of partitions initially chosen. The software also allows you to see the graph without axes. Although it seems like a nice feature, I cannot see its use, because a graph without axes is pretty chaotic.
The Good
The Bad
The Truth
Here are some snapshots of the application in action: