14 DAY TRIAL //
 Moo0 SystemMonitor allows you to monitor all the aspects of your system. The application has been built with the purpose of detecting values for sensitive sections of the operating system as well as read the sensors off hardware components and show information about their state.
Having a clue about the way the various system components can be sometimes make the difference between backing up your files just before the system fails and losing all your data. Also, monitoring the operating system and pinpointing the applications with negative impact on its performance lead to a faster solving of the issue.
The application is free of charge (for home use only) and no installation is required to take advantage of the information it displays. Also, you can carry it on a removable storage device and use it on any computer you want, as it is portable. If you plan on using Moo0 SystemMonitor at work, you are free to do it as long as you make a donation of any amount in order to obtain a commercial license.
There is no interface to fiddle about as the program dives straight into the action by displaying some of the most important values. These include the current status of CPU load, the CPU temperature, RAM load, amount of free memory, total hard disk usage, network load, number of connections, amount of processes currently running as well as the number of threads and handles. Another piece of information available is computer uptime.
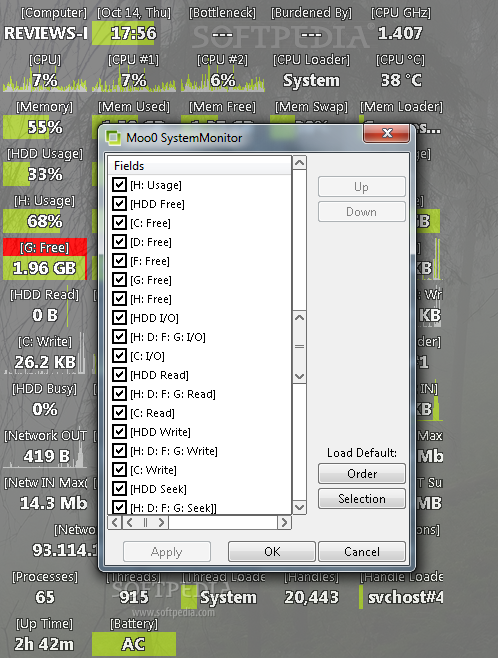
All these details are available in a vertical band like display that can be resized and moved around on the desktop. If you need more details, Moo0 SystemMonitor can definitely offer more than what an average user can handle. They are a right-click away, under “Fields” menu.
The sheer number of options in this section of the program is simply overwhelming. Just for the network Moo0 SystemMonitor provides a complex set of statistics, like current traffic coming in or going out, maximum amount of bits moving in and out of the system (and this is not all).
A close eye is kept on RAM as well. Just like Windows Task Manager, the application provides details about the amount of memory currently in use (percentage and in GB) and how much there is still available to the system.
Hard disk usage is also tagged by Moo0 SystemMonitor, offering statistics about free space for each of the drives. Even more, per drive I/O is closely monitored by the program, relaying the info to you in real time.
Given the large pool of details Moo0 SystemMonitor gathers, hard disk read/write values are present as well; again, for each drive.
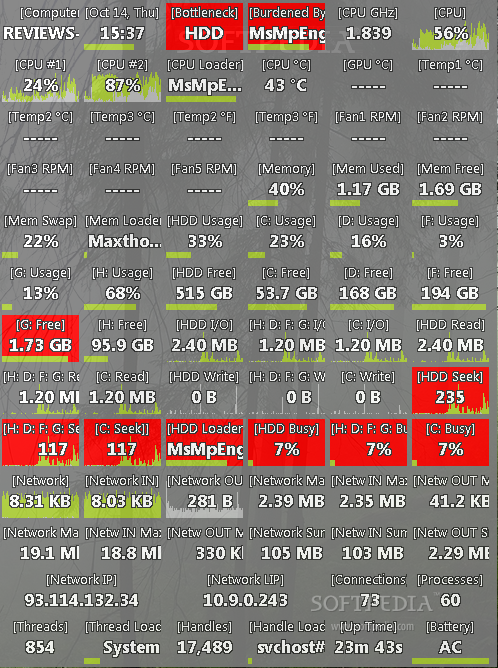
Simply giving you the facts about hardware components (supported ones, at least) or current performance status of the entire system is not all Moo0 SystemMonitor can do. The best of its features is the fact that it can point you to the application or part of the system that is causing the performance downfall.
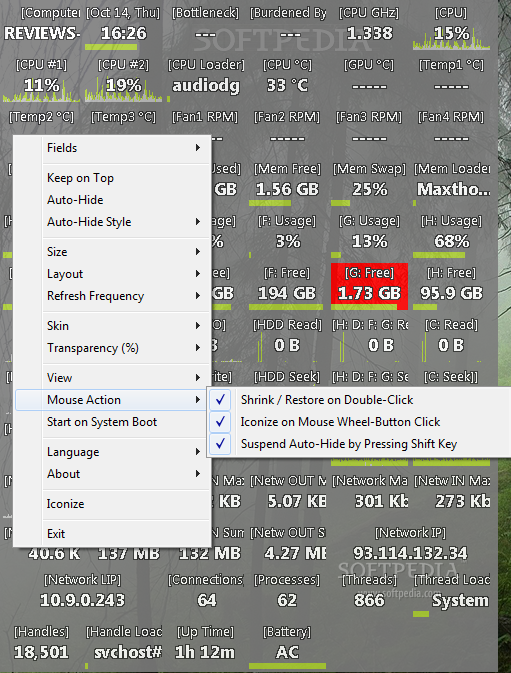
You will be able to see the hardware component responsible for overall performance, or the process that is taking all of the CPU; it will also identify the culprit gulping up too much RAM. All this info is highlighted in red to see it easier.
We noticed that one of our drives was always marked with red by Moo0 SystemMonitor, although there was nothing wrong with it except for the fact that it was incredibly small (for testing purposes) compared to all the other partitions. But as soon as we upsized it to 30GB the critical red mark disappeared.
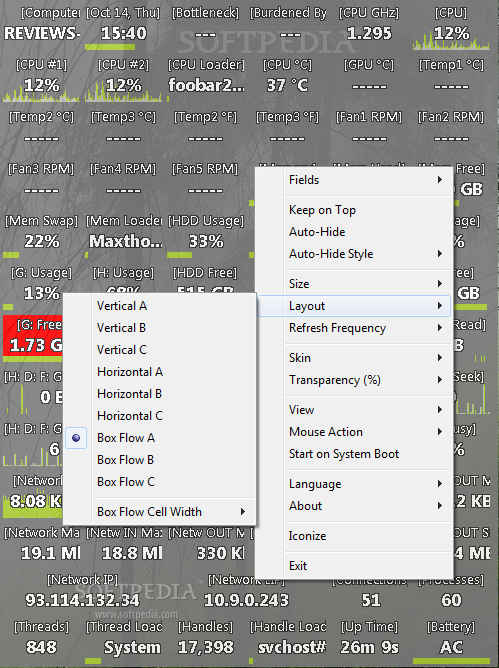
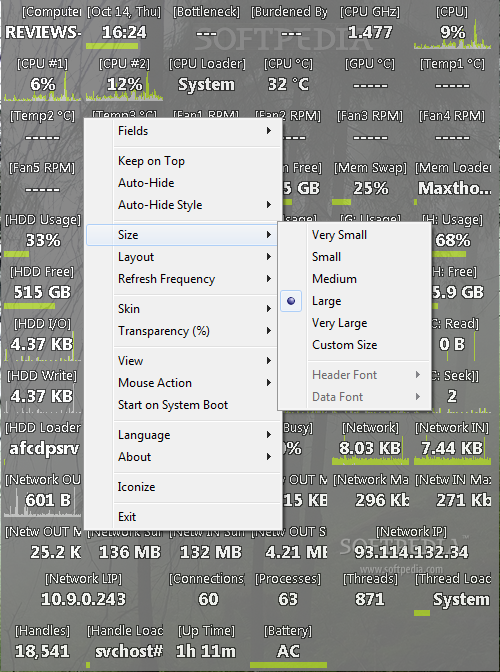
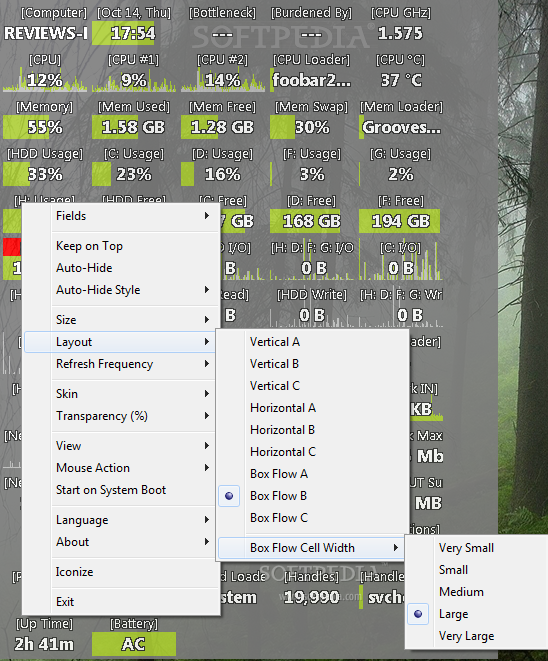
Despite its purpose to gather and display system statistics, Moo0 SystemMonitor can also be configured in terms of frequency of reports or transparency level of the display area. Modification of the default display strip is also possible; you can make it horizontal or shape it as a box, with different cell sizes (we set these to very large in order to see the complete description of the cell).
Its behavior upon mouse action is also subject to your preferences: shrink/restore on double click, send to system tray when wheel button is pushed or suspend auto-hide by pressing shift key.
Moo0 SystemMonitor may not offer the friendliest display for the data it gathers and it may not rake performance details for all hardware components, but it makes for a great utility if you want to see the culprits impacting on system performance.
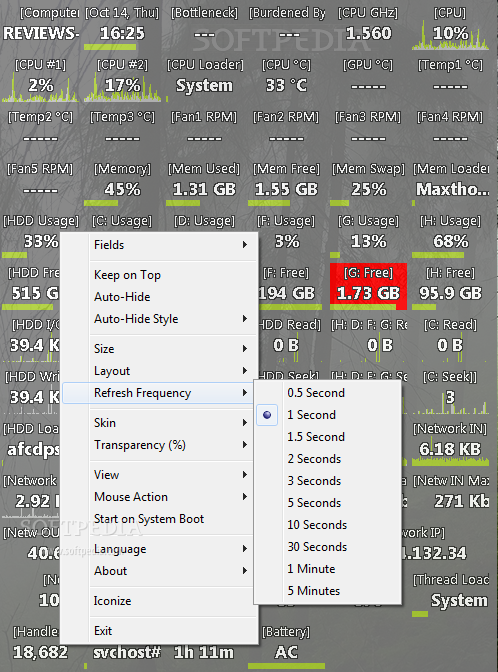
You can configure the display area to show all the details so that nothing is intrusive. Refresh frequency is customizable to as low as half a second or as high as five minutes. It is easy to use and it can be sent to system tray in a jiffy, or you can minimize it on the desktop. Either way, Moo0 SystemMonitor will continue the monitoring according to the pace you impose.
The Good
The Bad
The Truth