14 DAY TRIAL //
 Speccy is a system info utility that quickly collects specs about your hardware and software in a single place to help you figure out what makes your computer tick. This way, it spares you the trouble of exploring Windows Device Manager to find a particular piece of information.
The tool can also indicate the temperature of the device in real time to prevent heating issues, as well as create detailed reports and take snapshots to compare the state of the PC at different times or to share with an expert for troubleshooting.
There's a lot of info displayed about the system, CPU, RAM and other machine parts. Fortunately, it's cleverly organized in separate sections that can be clicked in the main window or selected from the View -> Sections menu. We're going to break them down in the following steps to hopefully make Speccy easier to understand and use.
Summary, Operating System
The Summary area wraps up the core intel when it comes to the operating system, CPU and storage (including real-time temp), memory, motherboard, graphics, optical drives, and audio devices.
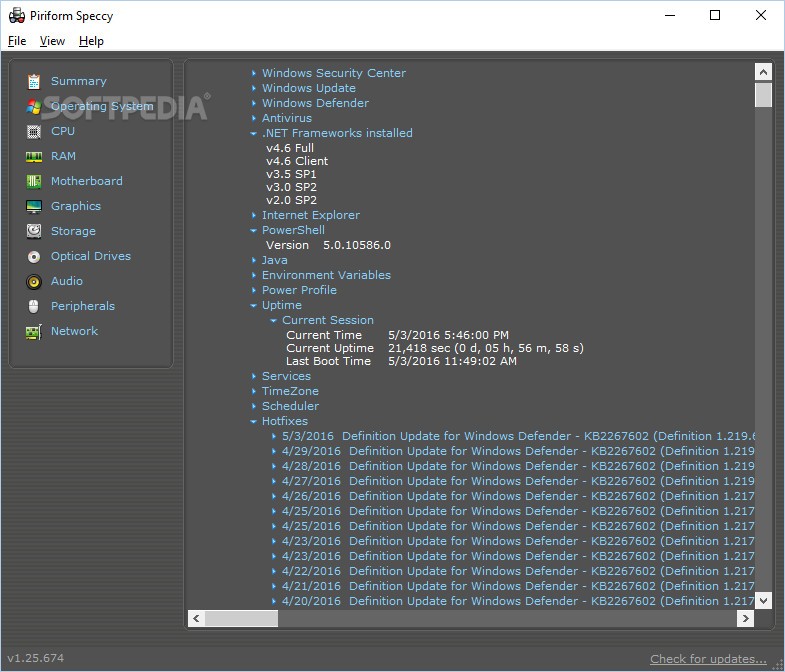
In the Operating System section, you can view general details, such as the OS type, serial number and computer type. It has various sections that can be expanded or collapsed by double-clicking an entry in the list. These include Windows Security Center (User Account Control and Firewall status, notification level) along with the Windows Update, Defender and Antivirus status.
Furthermore, you can find out all installed versions of .NET Framework, the Internet Explorer and PowerShell editions, Java Runtime Environment data (path, version, update, build), paths to the environment variables (user and machine), power profile (active power scheme, hibernation), for how long your PC has been running (uptime), running and stopped services, scheduled tasks, as well as hotfixes, system folders, and running processes.
CPU, RAM
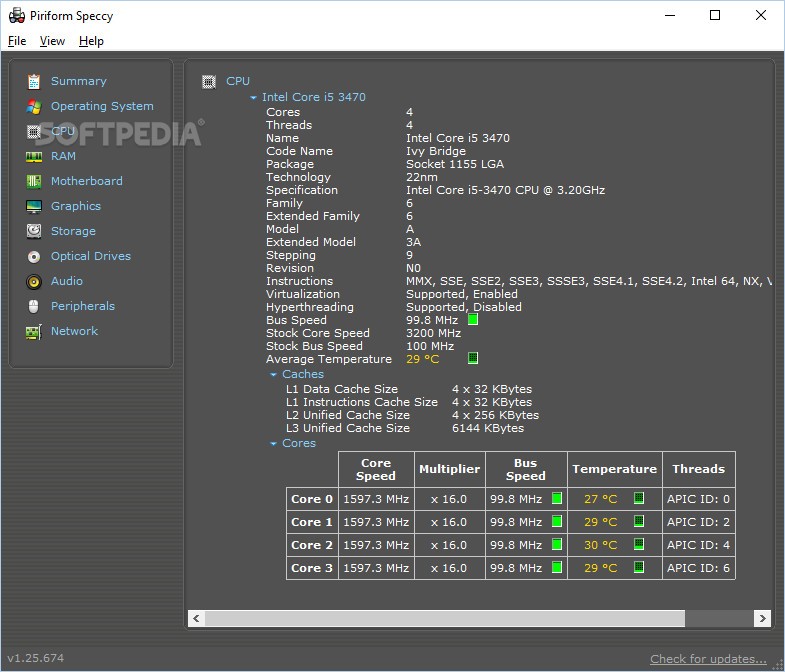
The CPU area shows technical details, such as the number of cores and threads, code name, package, technology, family, stepping, instructions and hyperthreading. Also, you can view graphs with the evolution of fan and bus speed as well as the average temperature by clicking on the small icons next to these listed entries. Graphs for the bus speed, rated bus speed and temperature of each CPU core are also available (in Cores).
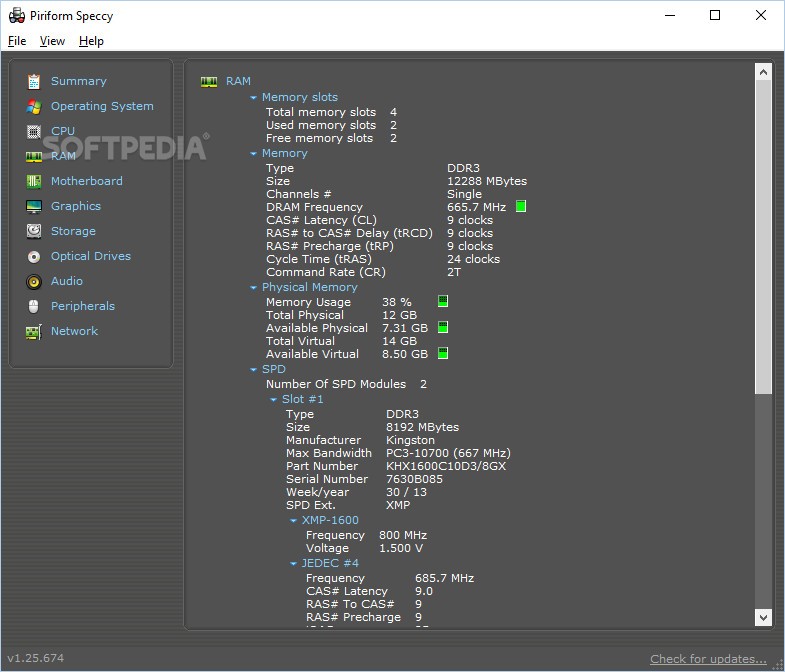
In the RAM section, Speccy shows details about the total, used and free memory slots, RAM type, size, the number of channels and SPD modules, the timing table for each slot, and graphs with the evolution of DRAM frequency, memory usage, available physical RAM, and memory usage.
Motherboard, graphics
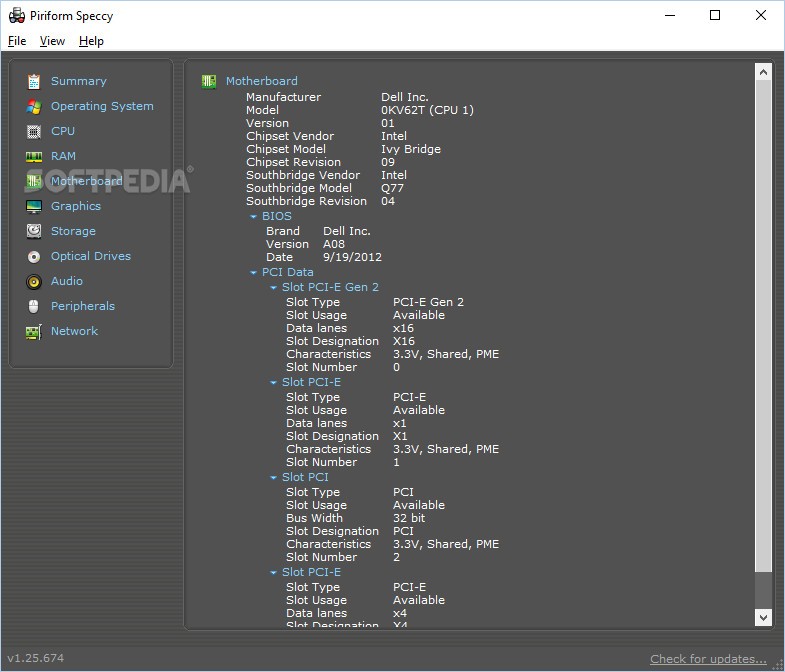
In the Motherboard area, you can find out the motherboard's manufacturer, model, version, chipset vendor, model and revision, a graph for the system temperature recently recorded, together with details about your BIOS (brand, version, date) and each slot of the PCI data (slot type, number, usage, designation, data lanes, characteristics).
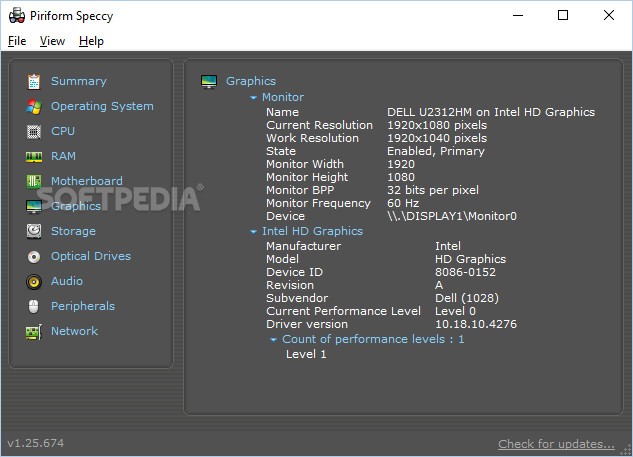
The Graphics part of Speccy contains info about your monitor, like current and working resolution, state, width, height, bits per pixels and frequency. Details about the graphics card are available too, such as model, device ID, revision, subvendor, current performance level, and driver version.
Storage
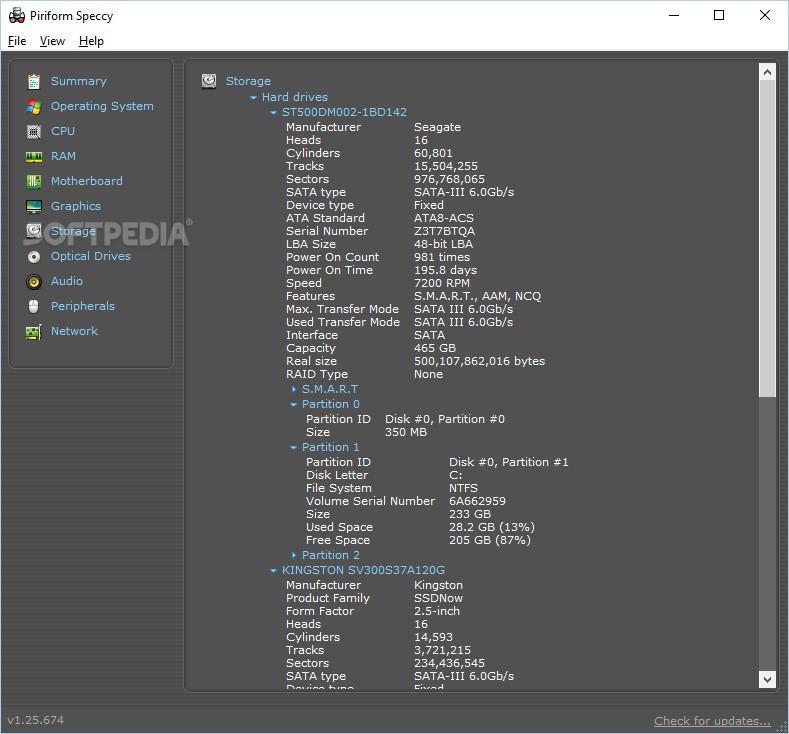
The Storage area facilitates information not only about hard drives but also about removable storage devices, like pen drives or memory cards. Besides the name and capacity of each device, you can find out the manufacturer, cache size, sectors, SATA and device type, serial number, firmware version number, how many times and for how long the device has been used, speed (rotations per minute), maximum and used transfer mode.
Additionally, you can view the ID, disk letter, filesystem, volume serial number, size, used and free space of each partition, along with the S.M.A.R.T. attributes, which give you an idea of how reliable the drive is, in order to expect and prevent hardware failure. To simplify this, Speccy shows the status of each attribute, such as the read error rate and temperature, as "Good" (green) or "Bad" (red).
Optical Drives, Audio, Peripherals
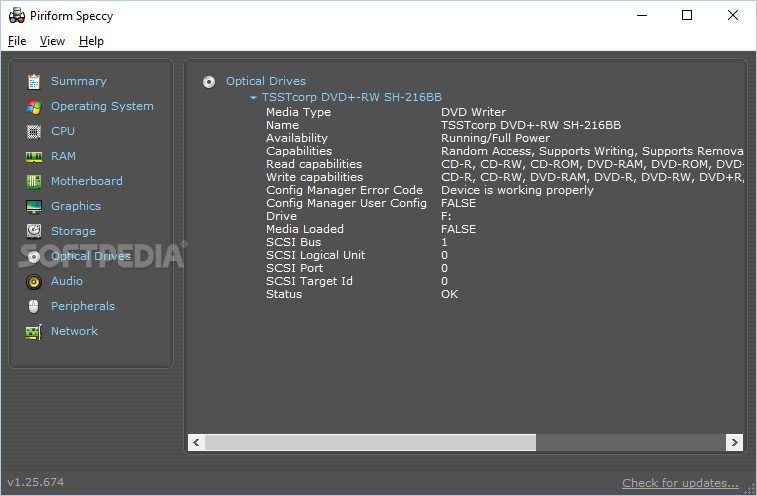
In the Optical Drives section, you can find out the media type, name, availability, general and reading capabilities, assigned drive letter and status of each optical drive identified on your workstation, such as CD-ROM or DVD-ROM.
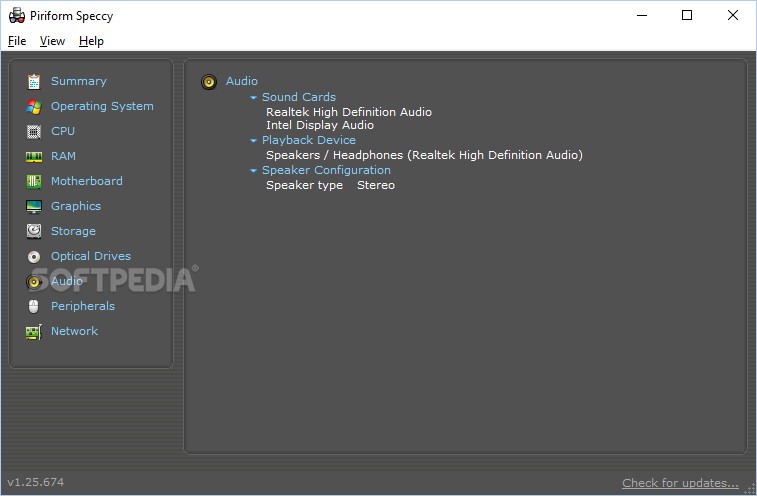
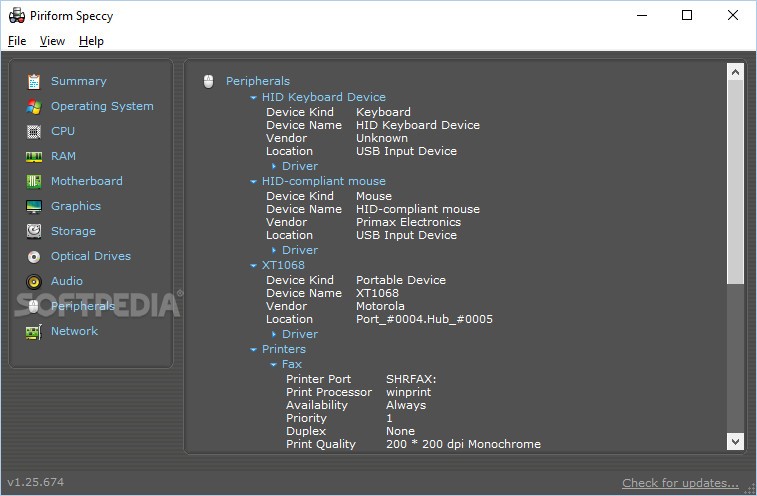
The Audio area lists your sound cards, playback and recording devices, but doesn't show more details about them. The Peripherals section is a bit more detailed, though, displaying a list of auxiliary devices and their names, type, vendor and location and driver (if any). Some peripheral devices include keyboards, mice, webcams, USB video devices, printers and faxes, and virtual printers.
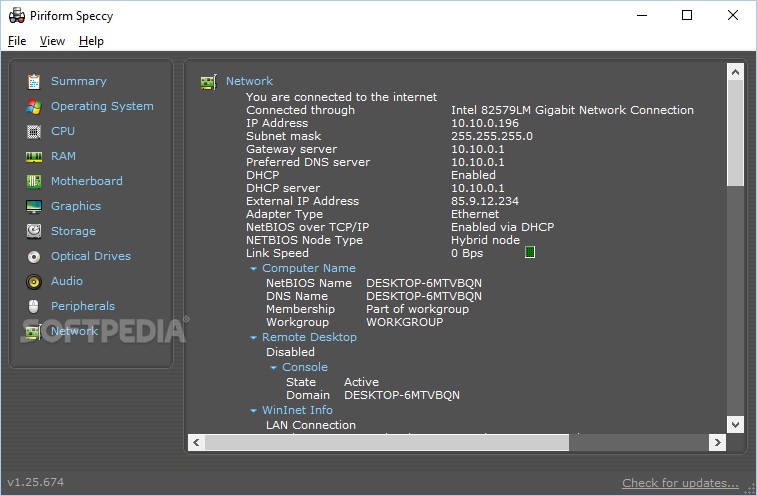
Network
The last section, Network, contains tons of information about your Internet and local network, starting with the external IP address, address type, NetBIOS node type and a graph with the recently recorded link speed (click on the small icon next to Link Speed).
More data can be analyzed when it comes to the computer name (NetBIOS and DNS name, membership, workgroup), Remote Desktop (state, domain), WinInet (VPN, modem, RAS), all wireless networks in your range (security type and algorithm used for connection, frequency, channel number, network flags) and WinHTTP (session proxy, connect retries, send timeout, proxies).
You can also check out details on Sharing and Discovery (administrative shares, simple file sharing, private and public profiles), all your network adapters (connection name, NetBIOS over TCP/IP, DHCP enabled, MAC and IP addresses, subnet mask, gateway and DNS server), network shares (full folder paths) and all current TCP connections (process name and ID, local IP address and status).
Save snapshots, create reports, view real-time temp
From the File menu, you can capture images with info from all sections to Save Snapshots to file, later open to view recorded details (Load Snapshot) or upload on the developer's website to obtain a unique URL that can be easily shared with an expert for diagnosing hardware issues (Publish Snapshot). It's also possible to print or save text files with the reports in XML or TXT format.
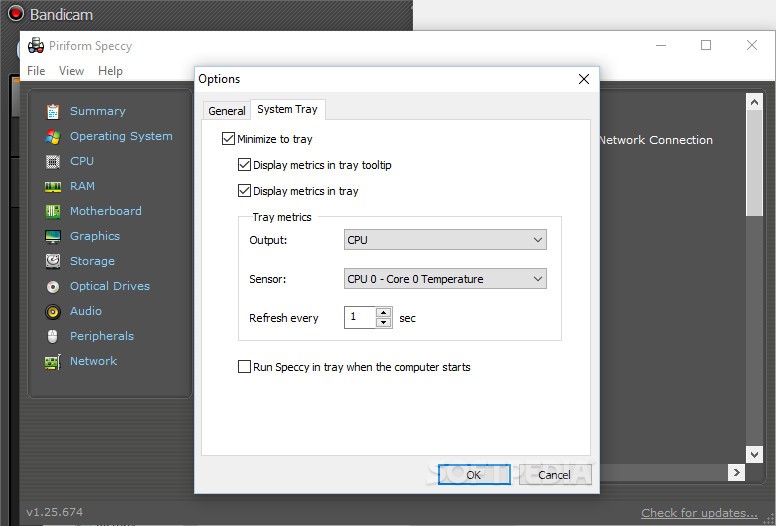
If you go to View -> Options, you can change the temperature display unit (Celsius or Fahrenheit), allow Speccy to skip User Account Control (UAC), and set the tool to minimize to the systray (right side of the taskbar, near the system clock).
This condition is necessary if you want to enable temp indicators for the CPU, motherboard or storage (it will show the current temperature inside the systray icon after minimizing the application). To make this happen, you can go to the System Tray tab in Options, and check the box next to Display metrics in tray, click on the menu next to Output to choose the hardware component you want to monitor. Then, you need to click on the menu next to Sensor to pick the CPU core, motherboard sensor or storage device, set the frequency for verifying this data (Refresh every n seconds), and confirm the action by clicking Ok.
To view all these features, check out the video below. Feel free to download Speccy.
Speccy Usage, Guide and Feature Demo
Speccy is an advanced system information tool that shows tons of info about your hardware and software in one spot for easy access. It may seem too much to the average user, but you can check out this video and article to find out how straightforward it actually is: http://www.softpedia.com/blog/speccy-explained-usage-video-and-download-503639.shtml