14 DAY TRIAL //
 To prevent your hardware from overheating, you can resort to software apps designed to monitor device temperature and notify you when it gets too high.
In the following guide, we're breaking down three such tools to show you how to keep an eye on your device temperatures and set alerts in the systray to easily spot them when working or playing on the computer: SpeedFan, Real Temp, and Hardware Sensors Monitor.
SpeedFan
SpeedFan reads the S.M.A.R.T. values and temperatures of your hard disks to modify the fan speeds accordingly (also known as overclocking). It creates an icon in the systray when fired up, which shows the hard drive temperature in real time. Move the mouse cursor over this icon to view the temps of your CPU cores too.
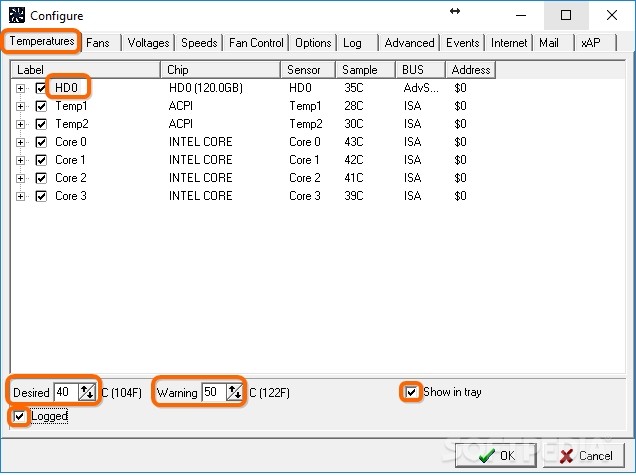
Double-click the tray icon to bring up the main app window. SpeedFan also displays the sensor temperatures in the Readings tab. Click Configure, select a label from the Temperatures tab, set the Desired and Warning temps on the bottom side, and check the Show in tray box.
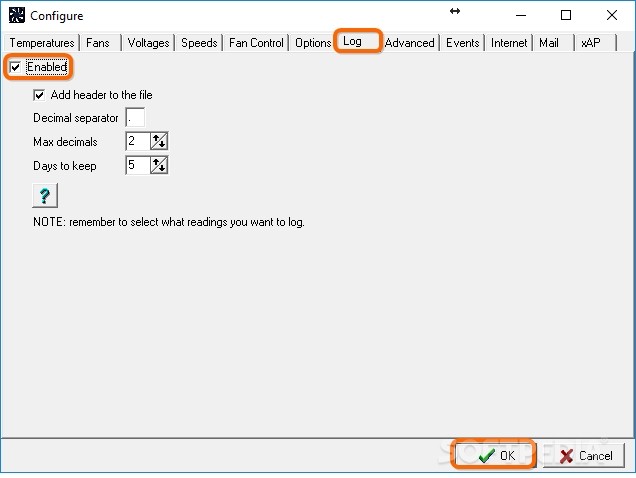
If you want to capture temps at different times and save statistics to a log file, tick the Logged box of each entry, then go to Log tab in the Configure panel, and tick the Enabled box. Click Ok to apply changes.
Real Temp
Real Temp doesn't require installation, so you can double-click the executable file from the downloaded package to launch the application. It displays temperatures of devices with Intel Core-based processors, and it can perform sensor tests as well as run benchmarks to measure performance and give you scores.
Once launched, it creates an icon in the systray that shows the real-time temperature of your first CPU core. Hover the mouse over this icon to view the temperature of the remaining CPU cores.
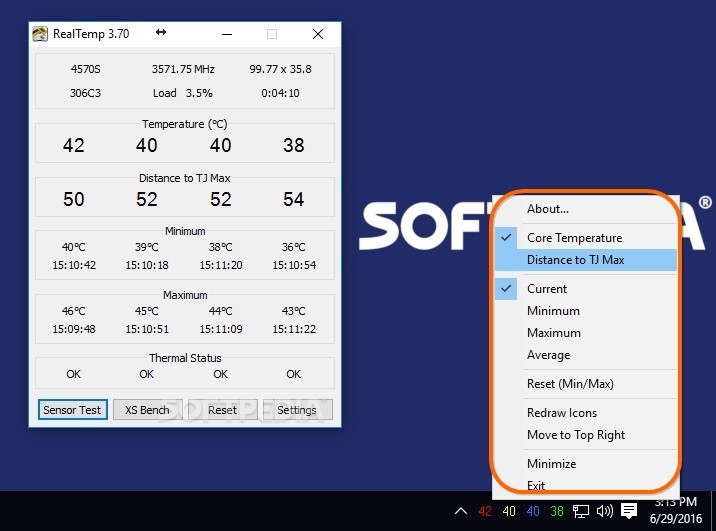
Right-click the tray icon to view Distance to TJ Max (maximum allowed CPU temperature before the tool auto-changes the fan speeds) instead of Core Temperature. Also, you can see the Minimum, Maximum or Average temperature instead of the Current one, or reset the minimum and maximum values (click Reset Min/Max).
Double-click the tray icon to bring up the main window of Real Temp and view additional information, such as the exact time when the Minimum and Maximum temperatures were recorded, along with the Thermal Status.
To make the tool automatically save this data to a log file, click the Settings button, check the Log File (seconds) box, specify the time capture frequency (in seconds), click Apply, then right-click in the main window, choose Set Log File Location, and tell Real Temp where to save the log file and what you want to call it. Only one log file will be saved, which will be regularly updated with the CPU core temperatures, Load (%) and Frequency, along with the Date and Time.
To change the TJ Max value displayed in the systray, click the Settings button, then Set TJ Max to edit the default temperature values for each CPU core.
To customize the font color of each CPU core systray indicator, find Notification Area Color and Font in the Settings panel, tick the box below the core you want to change, then click the core button and pick a preferred color. Make sure to establish different colors to tell them apart more easily.
To set up alarm temperatures, find the Other settings area, tick the Alarm Temperatures box, set the CPU limit, click Alarm EXE to schedule a program to launch when the alarm goes off, then click Apply.
Hardware Sensors Monitor
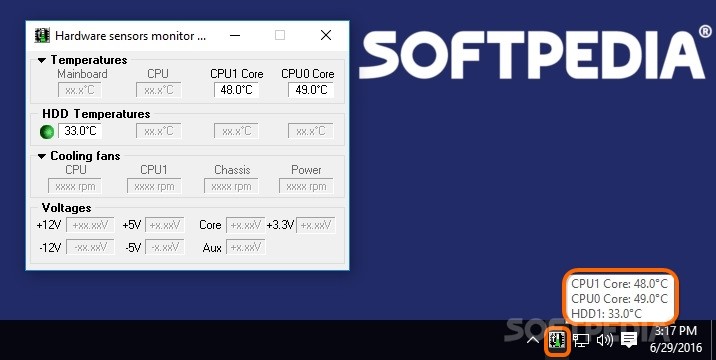
Hardware Sensors Monitor creates an icon in the systray at startup, which shows the current temperatures of your CPU cores and hard drives when hovering your mouse cursor over it.
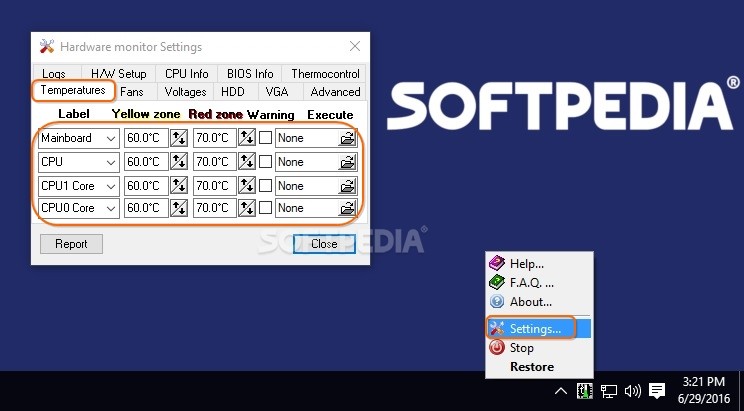
To set alarms on exceeding temps when it comes to the mainboard and CPU cores, right-click the tray icon, click Settings, and go to Temperatures tab. You can edit the default Labels, set two temp values to indicate the reached limit (Red zone) and medium level (Yellow zone), tick the Warning boxes, and click the folder icons in Execute column if you want to open an audio file to use as alert or to launch a program when the sensor reaches the temperature you specified in Red Zone.
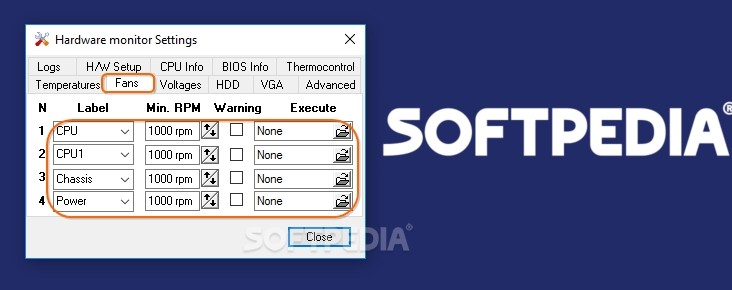
To set alarms for fans, go to Fans tab, and edit the Labels for the CPU cores, along with Chassis and Power. You can set the minimum number of rotations per minute in order to trigger the alarm if the fan speed drops below this number (Min. RPM), tick the Warning boxes, and click the folder icons in Execute column to open an audio file or launch a program on the warning.
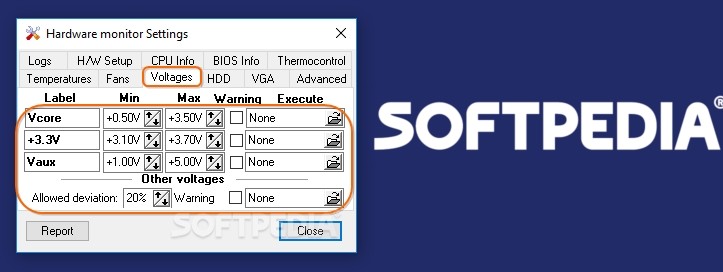
Also, you can set alarms for voltages (Voltages tab -> set the Minimum and Maximum values as well as Allowed deviation to trigger warnings if the voltages get too high or too low), hard drive (HDD tab -> set Yellow zone and Red zone for each hard drive) and VGA (VGA tab -> set the minimum and maximum GPU and GA temps, VGA Fan rpm, Core and Bus Voltage).
To record statistics to a log file, go to Logs tab, tick the Event and Data log boxes, click the two folder icons to indicate the saving directory and name of the Event log and Data log files, and set the Data log interval.
Hardware Sensors Monitor also has features for enabling, disabling and correcting device temperatures.
Play our video guide below to see how these three applications work. You can also download SpeedFan, Real Temp, and Hardware Sensors Monitor.
Monitor Device Temps and Set Alarms Using These Tools
To prevent your hardware from overheating, you can resort to software apps designed to monitor device temperature and notify you when it gets too high. Check out our video and article: http://www.softpedia.com/blog/monitor-device-temps-and-set-alarms-using-these-tools-505752.shtml