A mathematical curve and function plotting tool. #Mathematical curve #Mathematical function #Curve plotter #Plotter #Plot #Grapher
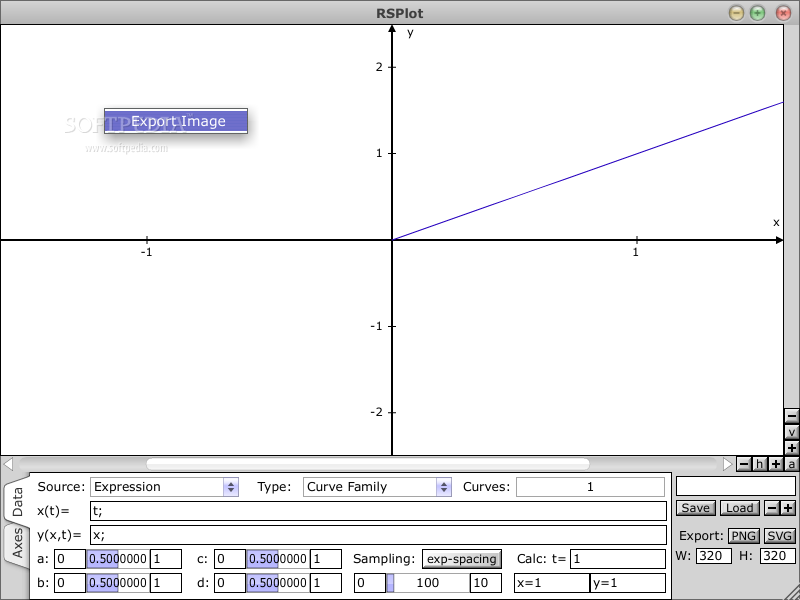
The RSPlot application was developed to be a mathematical curve and function plotting tool. It supports plotting of single curves or functions, parametrized curve/function families and plotting of several unrelated curves/functions in one single plot. The result can be exported to an .svg vector graphics file or to a .png bitmap graphics file.
RSPlot allows for plotting several curves into one single plot. These curves may or may not be related with one another. For a (parameterized) curve or function family, you may use the character n inside the equations which is always assigned to the index of the respective curve which is currently drawn.
The minimum value for n is always 1 and the maximum value is given by the number of curves which should be drawn (as selected via the ’Curves’ slider). For example, the expressions x(t) = t; and y(x, t) = cheby(x, n − 1); will draw all Chebyshev polynomials from order 0 to N − 1 where N is the number of curves.
You may use subexpressions as decsribed above to paramterize the curves by different values than the curve index, for example, you could have been written: k = n − 1; cheby(x, k); in the y-expression field without changing the result. And of course you can use more complex expressions to derive the curve-parameter k from the curve-index.
- runs on:
- Windows All
- file size:
- 716 KB
- filename:
- RSPlot.zip
- main category:
- Science / CAD
- developer:
- visit homepage
Bitdefender Antivirus Free

7-Zip

ShareX

IrfanView

calibre

Context Menu Manager

Microsoft Teams

Zoom Client

Windows Sandbox Launcher

4k Video Downloader

- Zoom Client
- Windows Sandbox Launcher
- 4k Video Downloader
- Bitdefender Antivirus Free
- 7-Zip
- ShareX
- IrfanView
- calibre
- Context Menu Manager
- Microsoft Teams