Chart various stock market data using this application that allows its users to apply statistical methods such as regression lines to accurately analyze the information. #Stock graph #Technical analysis #Price plotter #Stock #Trade #DAX
Doing your due diligence is necessary if you're looking to invest in the stock market. Though, now and then, the stock market likes to bare its fangs to show every analyst and investor that nothing is certain, researching a company's strengths and weaknesses can never be a bad time investment. You are investing your hard-earned money, after all.
Tracking a ticker's movements is necessary for this research, and though several online platforms offer market graphs for you to effortlessly look up a company, they can feel largely rudimentary at times. A tool like GRAFster seeks to correct that: designed to be a tool where one can thoroughly track stocks on the market, herein is a lot of versatility you simply do not get with web-based solutions.
From the looks of it, this is a tool for investors — or those who are passionate about the stock market. Either way, users can set up their tickets just how they want them, and the options for customization allows you to delve as deep as you want.
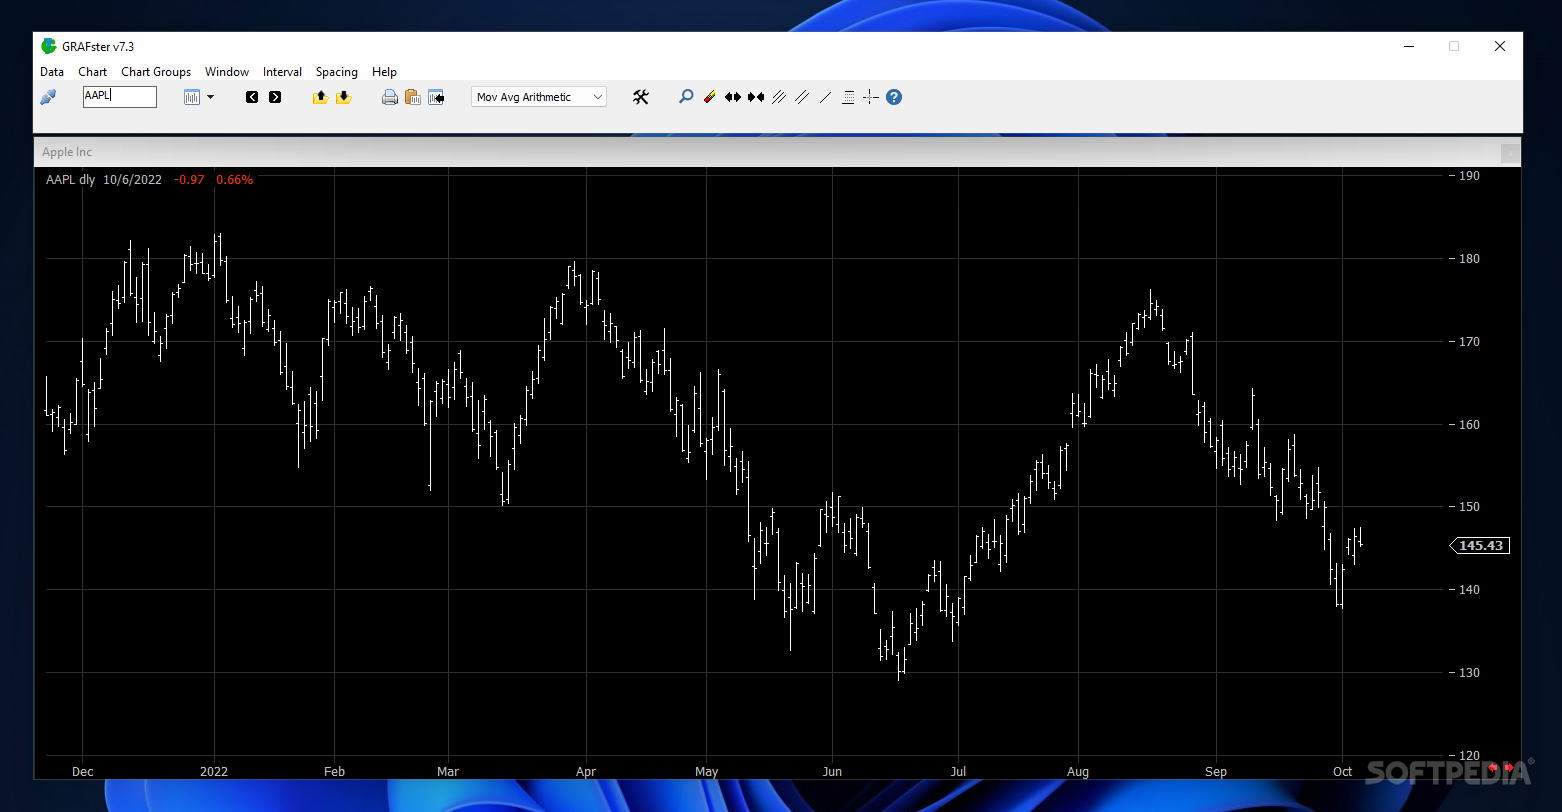
First off, you'll need to specify where to fetch market data from. Yahoo, Tiingo, Nasdaq, and FinnHub are the supported sources. We found that Nasdaq worked best, so we went with that one. Upon doing so, we were able to freely search any symbol we wanted: inputting AAPL would provide us with the year-to-date performance of the company, allowing us to freely look through the data.
Working with this tool is quite easy, and the convenience factor is further improved upon by the modular interface, which allows the user to watch multiple tickers, while requiring little effort to set everything up. Input the names of the companies you wish to track, then resize the opened windows so that you can see everything properly.
To add to that, lots of additional information on a company can be provided by way of dragging elements from the dropdown of the top bar. Moving averages, support-resistance metrics, volatility, CCI, swing and regression lines, and other such data can be provided at a moment's notice, and in a very intuitive manner to boot.
What's more, users can manage chart groups, which make it easier to bring up your watch-listed companies anytime. Simply bring up the tickers you wish to monitor, and save the opened charts as a group, so that you can load them anytime. Users can also share the chart in multiple ways: saving as an image, printing it, as well as copying it to their clipboard.
GRAFster might seem quite unwelcoming at first, but once you spend a little bit of time with it, you'll learn to appreciate the overall practicality on display.
What's new in GRAFster 7.4.6.11:
- Added Aggressive Kombo indicator
GRAFster 7.4.6.11
add to watchlist add to download basket send us an update REPORT- runs on:
-
Windows 11
Windows 10 64 bit - file size:
- 4.3 MB
- filename:
- grafster74_setup.exe
- main category:
- Others
- developer:
- visit homepage
7-Zip

Bitdefender Antivirus Free

IrfanView

4k Video Downloader

Zoom Client

Microsoft Teams

Windows Sandbox Launcher

ShareX

calibre

Context Menu Manager

- ShareX
- calibre
- Context Menu Manager
- 7-Zip
- Bitdefender Antivirus Free
- IrfanView
- 4k Video Downloader
- Zoom Client
- Microsoft Teams
- Windows Sandbox Launcher