Visualize numerical data and generate 2D and 3D plots, plot various types of functions (e.g. sin, cos, tan, cot, sec), and print plots or export them to EPS, PNG or PDF file format #Create graph #Plot graph #Graph plotter #Plotter #Math #Graph
Mjograph is a Windows graph editor whose purpose is to help researchers edit x and y graphs in order to compute different types of simulations and visualize the numerical results.
The portable running mode comes with several benefits to your system. You may run it by simply opening the executable file (there’s no setup included in the process) and copy it on any USB flash drive or other portable devices.
It does not leave traces in your Windows registry so you can get rid of it by deleting the package that you have grabbed from the Internet.
This is a Java-based app, so you need to previously deploy the working environment on your computer.
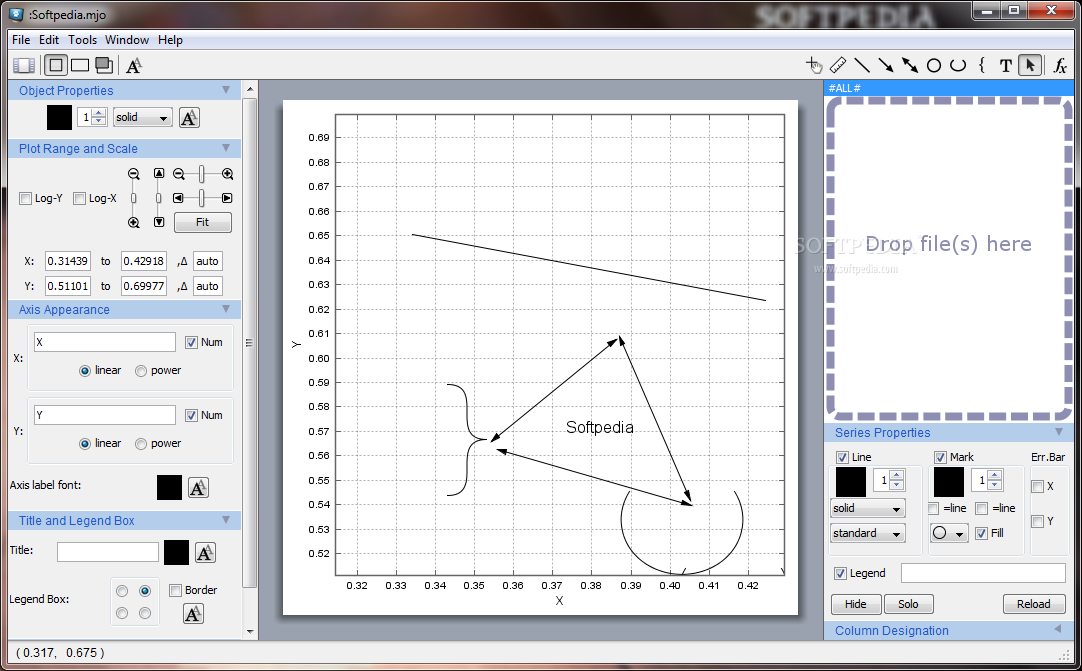
Mjograph reveals a well-structured suite of features where you can opt for generating a 2D or 3D graph. Several sidebars include additional configuration parameters that can be used for altering the object properties, plot range and scale, axis appearance, title and legend box, graph background, and coordinate selection.
In case you want to focus solely on the graphs, you can hide the sidebars and adjust the graph size to fit your preferences.
Mjograph lets you drag and drop your data files (CSV file format) directly into the main window or plot the content from clipboard data. You may print the information, copy it to the clipboard, or export it to EPS, PNG or PDF file format, while selecting the preferred color format (color, grayscale or black & white).
You are given the freedom to undo or redo your actions, and cut, copy, paste or delete all objects. You may plot user-defined math functions (explicit or parametric form), zoom in or out of the graph, and draw different objects using predefined shapes, such as lines, arrows, and circles.
You can make use of a ruler for measuring the distances between two points, plot various types of functions (e.g. sin, cos, tan, cot, sec, arcsin, sqrt, exp), and write mathematical symbols in the graph.
Mjograph supports a smart set of features for helping you visualize numerical data and generate plots. The clean feature lineup makes it suitable for rookies and professionals alike.
What's new in Mjograph 4.6.1:
- The fonts for the axis labels and numbers can now be separately changed.
- In the batch change of font, an arbitrary font can be selected.
- Reloading all the imported series via a menu.
- Bug fix: a series could not be duplicated into a different frame.
Mjograph 4.6.1
add to watchlist add to download basket send us an update REPORT- runs on:
- Windows All
- file size:
- 21.4 MB
- main category:
- Others
- developer:
- visit homepage
Microsoft Teams

Context Menu Manager

Windows Sandbox Launcher

7-Zip

ShareX

Bitdefender Antivirus Free

IrfanView

Zoom Client

calibre

4k Video Downloader

- Zoom Client
- calibre
- 4k Video Downloader
- Microsoft Teams
- Context Menu Manager
- Windows Sandbox Launcher
- 7-Zip
- ShareX
- Bitdefender Antivirus Free
- IrfanView