Create profiles for JVM tools to identify and resolve bottlenecks with the help of a wide collections of tools and settings provided by this user-friendly app. #Java Profiler #Thread Resolver #Get Java Profile #Java #Profiler #Thread
Designed for Java programmers, JProfiler Portable is a resourceful application that can be used to analyze JVM tools, troubleshoot possible bottlenecks and resolve memory leaks.
Wrapped in a clean working environment, the program offers support for third-party integrations and even Java Enterprise Edition. Problems with database calls can be fixed thanks to JProfiler's JDBC and JPA/Hibernate probes. Meanwhile, slow database access and statement structure errors can be figured out using NoSQL probes for MongoDB, Cassandra and HBase.
As far as usage goes, developers can take advantage of JProfiler when it comes to attaching to JVMs (local or remote) and profiling application servers. Several demo sessions are available in the downloaded package to demonstrate how everything works. Ongoing projects can be saved as snapshots with all profiling results and later opened to pick up where you left off. HPROF and PHD snapshots can be opened too.
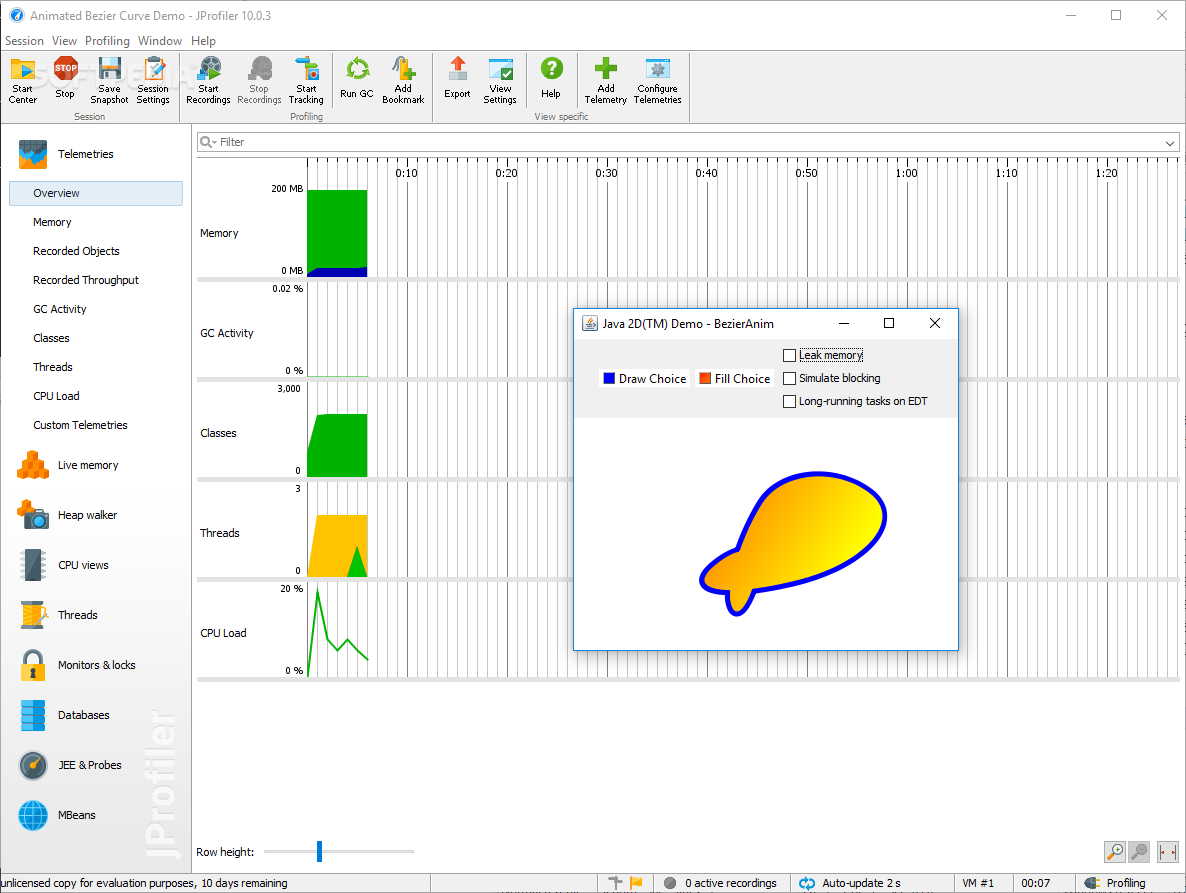
The main app window has a neatly organized layout where the telemetries (graphs), live memory data, heap walker, CPU views, threads, monitors and locks, databases, JRR and probes as well as MBeans folders can be separately accessed.
Integration wizards can be used to quickly set up new servers, remote connections, applets and install4j or exe4j projects. Moreover, application sessions can be converted to remote, offline or redistributed sessions. The IDEs supported for integration are IntelliJ IDEA, Eclipse, NetBeans, and Oracle Developer.
You can override the default JDK, define filters, exceptional, ignored and split methods for CPU profiling, create templates with profiling settings, and more. A wider range of options are available for configuration.
Everything worked smoothly on Windows 10 in our tests while the utility had a surprisingly low impact of system performance. To conclude, JProfiler Portable comes bundled with all the necessary tools for identifying and resolving Java-related issues. It should meet the requirements of many Java developers.
What's new in JProfiler Portable 14.0.2:
- New features:
- Full support for Java 22 virtual threads
- Support for virtual threads in HPROF snapshots
- Support for OpenJPA 4 in the JPA/Hibernate probe
JProfiler Portable 14.0.2
add to watchlist add to download basket send us an update REPORT- portable version
- This is the portable version of the application. An installable version is also available: JProfiler
- runs on:
-
Windows 11
Windows Server 2022
Windows Server 2019
Windows Server 2016
Windows 10 32/64 bit
Windows Server 2012 R2
Windows Server 2012
Windows 8 32/64 bit
Windows 7 32/64 bit - file size:
- 149 MB
- filename:
- jprofiler_windows-x64_14_0_2.zip
- main category:
- Portable Software
- developer:
- visit homepage
4k Video Downloader

7-Zip

Zoom Client

calibre

Windows Sandbox Launcher

Microsoft Teams

ShareX

Bitdefender Antivirus Free

Context Menu Manager

IrfanView

- Bitdefender Antivirus Free
- Context Menu Manager
- IrfanView
- 4k Video Downloader
- 7-Zip
- Zoom Client
- calibre
- Windows Sandbox Launcher
- Microsoft Teams
- ShareX