An OpenCL and OpenGL debugger and memory analyzer integrated into Microsoft Visual Studio #OpenGL debugger #Memory analyzer #OpenCL debugger #GDEBugger #Debugger #OpenGL
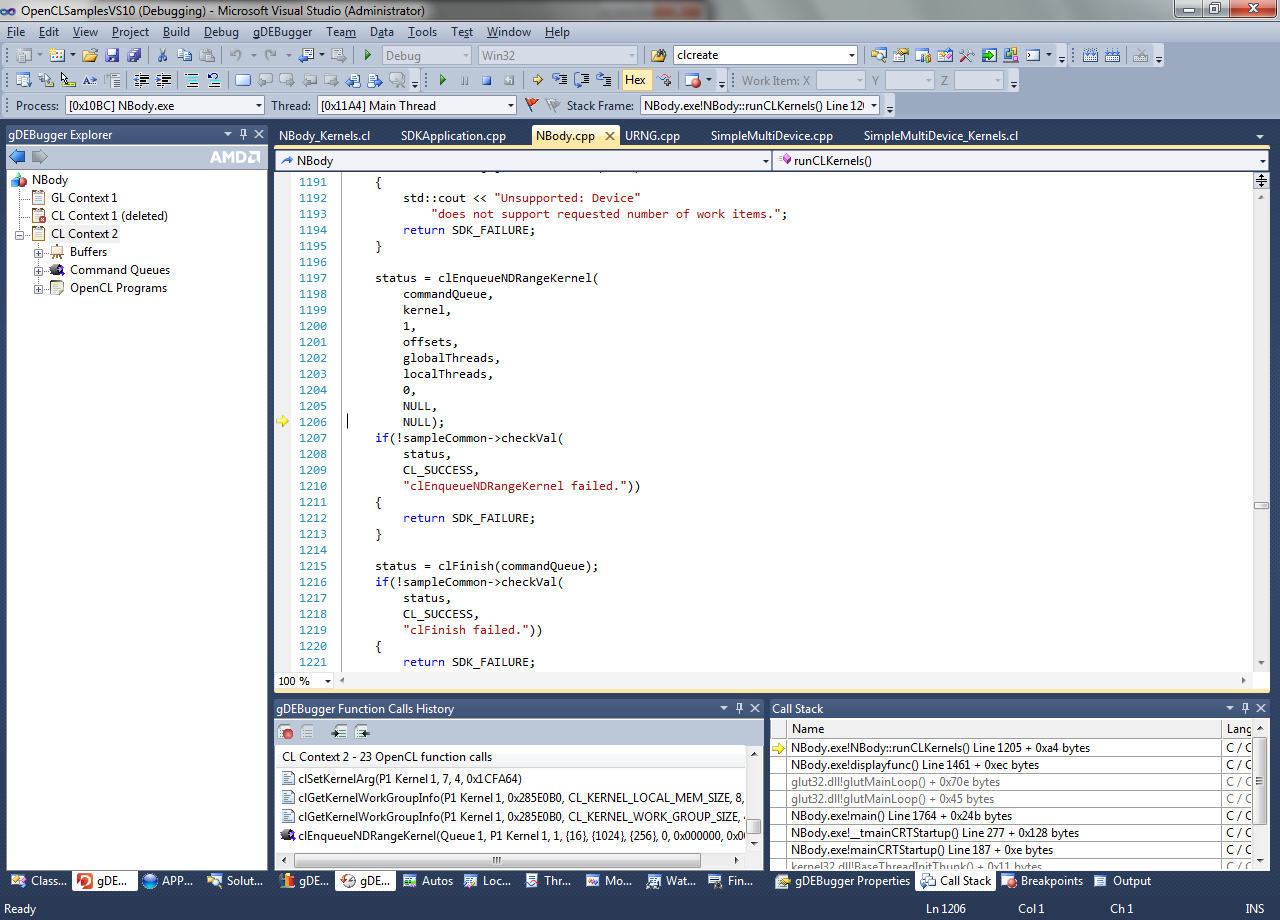
gDEBugger offers real-time OpenCL kernel debugging, which allows developers to step into the kernel execution directly from the API call that issues it, debug inside the kernel, view all variable values across the different work groups and work items - and all this on a single computer with a single GPU.
gDEBugger takes the mystery out of debugging OpenCL and OpenGL, allowing developers to peer into compute and graphic memory objects such as OpenCL images to view their contents as they change from write, copy, and kernel operations.
Allocated OpenCL and OpenGL objects are monitored to allow detecting memory leaks and the scenarios that caused the leaking objects to be created, API function call logs can be viewed and saved and unrecommended and deprecated functions and behaviors are marked, with best-practice alternatives offered.
Get AMD gDEBugger and take it for a test drive to see what it can actually do for you!
System requirements
- Microsoft Visual Studio 2010
- The latest AMD Catalyst driver
AMD gDEBugger 6.1.262
add to watchlist add to download basket send us an update REPORT- runs on:
-
Windows 7 32/64 bit
Windows Vista 32/64 bit - file size:
- 24.5 MB
- filename:
- AMDgDEBugger-VisualStudioExtension-6.1.262_signed.msi
- main category:
- Programming
- developer:
- visit homepage
Microsoft Teams

Zoom Client

calibre

Windows Sandbox Launcher

7-Zip

4k Video Downloader

Context Menu Manager

ShareX

Bitdefender Antivirus Free

IrfanView

- ShareX
- Bitdefender Antivirus Free
- IrfanView
- Microsoft Teams
- Zoom Client
- calibre
- Windows Sandbox Launcher
- 7-Zip
- 4k Video Downloader
- Context Menu Manager