Analyze memory blocks allocated in the heap of currently running processes, export information to file, and customize many settings #Inspect memory block #Process heap #Trace memory leak #Inspect #Heap #Tracer
HeapMemView is a feather-light and portable tool that lets you study information about memory blocks allocated in the heap of an active process. It comes in handy to software developers for identifying memory leaks in their products, in order to take the appropriate measures.
Since there is no setup kit involved, you can save the app directory in any part of the HDD and just click the .exe to launch HeapMemView. Another possibility is to copy it to a USB flash drive, in order to directly run it on any machine with minimum effort and no previous installers. It doesn't change Windows registry settings.
At startup, the program puts together a list with the currently running processes, including their icon, name and full path, asking you to pick the one you want to scrutinize for memory blocks.
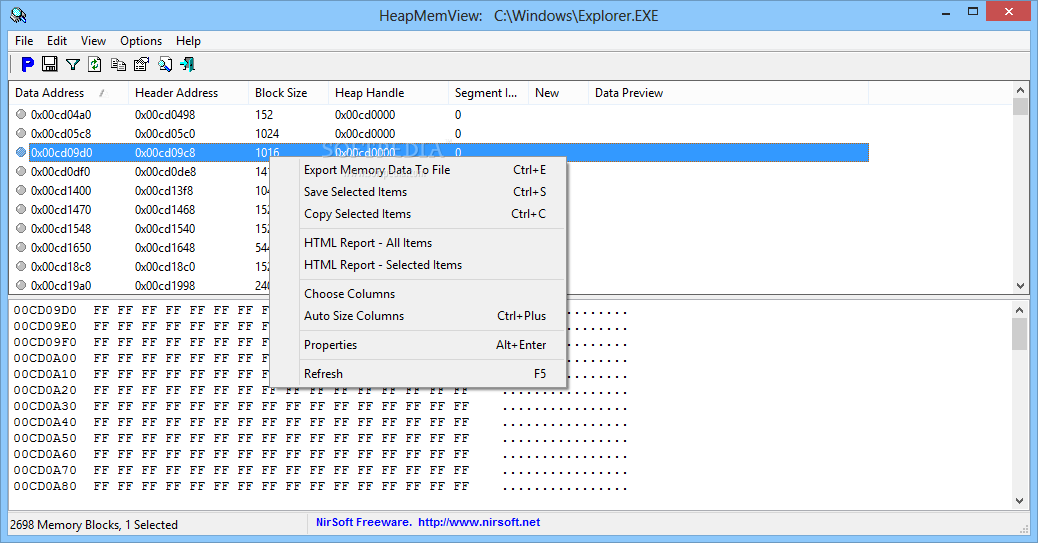
Information is immediately compiled and shown in the main window. You can find out the data and header address, block size, heap handle, segment index, whether or not is new, along with the data preview of each block. The status bar reveals the total number of blocks.
Clicking an entry from the list displays the hexadecimal code of a block. An important aspect worth noting is that HeapMemView doesn't implement options for editing data, since it's a read-only app. It's possible to copy selected items or all information to the Clipboard or export it to file (HTML, TXT, XML, CSV), as well as export the memory data to file.
You can hide any columns from display, use a basic search function when handling large amounts of data, choose the data preview mode (ASCII or hexadecimal), show memory block headers, and easily spot new memory blocks, since they are listed in color.
It's also possible to show characters in the memory headers above ASCII 127, automatically sort data on refresh, filter memory blocks by size, as well as configure advanced options concerning the number of bytes to display, byte number to start with, and number of bytes per line.
No error dialogs popped up in our testing, and the application didn't freeze or crash. It compiled information immediately while remaining light on system resources usage, using low CPU and memory.
To sum it up, HeapMemView gives you a pretty good view of the memory blocks allocated in active processes, and it's equipped with plenty of customization options for software developers.
What's new in HeapMemView 1.05:
- Added 'Automatically Sort On Refresh' option.
- Fixed the flickering while scrolling the upper pane.
HeapMemView 1.05
add to watchlist add to download basket send us an update REPORT- runs on:
-
Windows 2003
Windows 8
Windows 7
Windows Vista
Windows XP
Windows 2K - file size:
- 44 KB
- filename:
- heapmemview.zip
- main category:
- Programming
- developer:
- visit homepage
7-Zip

IrfanView

Microsoft Teams

Zoom Client

Bitdefender Antivirus Free

calibre

ShareX

Windows Sandbox Launcher

4k Video Downloader

Context Menu Manager

- Windows Sandbox Launcher
- 4k Video Downloader
- Context Menu Manager
- 7-Zip
- IrfanView
- Microsoft Teams
- Zoom Client
- Bitdefender Antivirus Free
- calibre
- ShareX