A suite of tools for Java developers that allows monitoring and troubleshooting Java applications and the Java virtual machine at runtime. #JVM diagnostics #Monitor Java application #Application performance #Diagnostics #Profiling #Performance
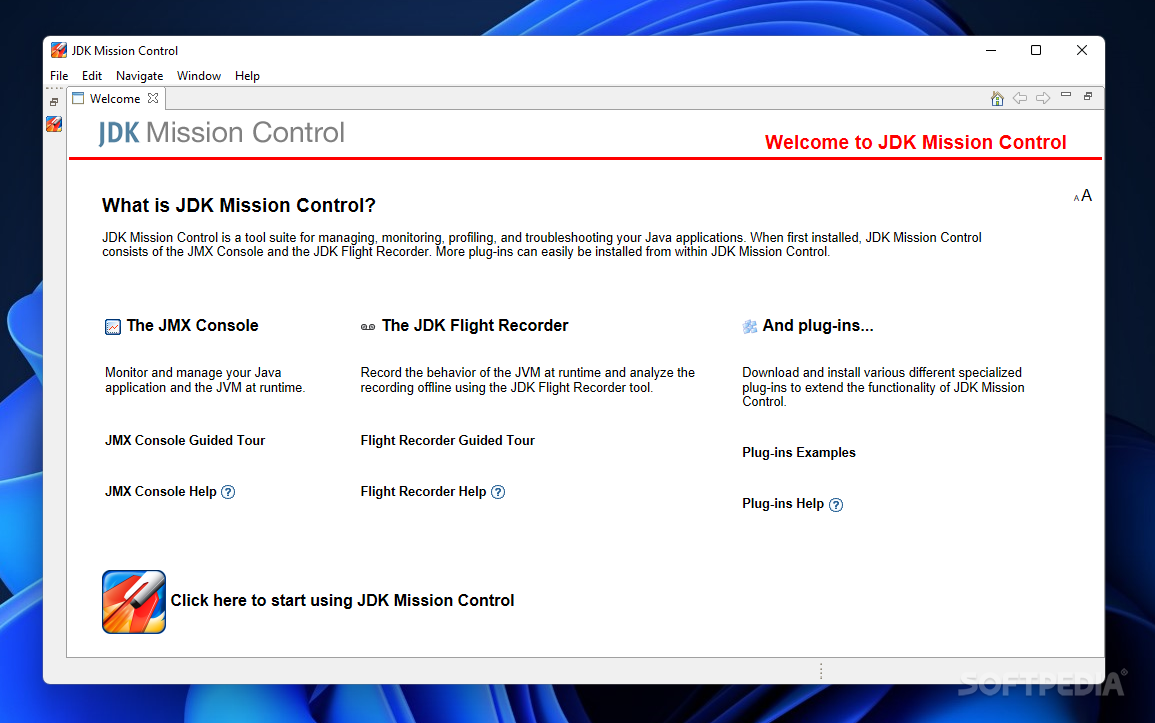
The JDK Mission Control or, in short, JMC, provides Java developers with a reliable suite of tools created by Oracle for diagnosing Java applications and performing monitoring and profiling operations. Its seamless integration with the HotSpot VM ensures a reduced performance overhead, allowing developers to identify potential issues, find causes and initiate troubleshoot endeavors even in production environments.
The JMC package consists of several tools, applications and plugins that work together to collect relevant, detailed information about running instances of the Java virtual machine. First and foremost, you will get to know the JVM browser, which displays a list of all the running Java applications and their corresponding Java virtual machines.
The MBean server allows you to manage the runtime properties of the JMX Console, a mechanism that collects and reveals the running characteristics of a Java virtual machine in real time. To facilitate quick responses and actions, you can configure the MBeans server to notify you via email or other means when a specific event occurs (for instance when the monitored Java applications uses too much processor power).
The Java Flight Recorder (JFR) is another tool in the suite and probably one of the most important. Also included in the OpenJDK package, the JFR is the one that collects extensive low-level profiling data for the monitored Java application, such as lock profiles, thread samples, and other diagnostics information, all displayed in tables and charts that are easily readable. The data collected by the JFR is usually requested if you end up contacting the Oracle support.
JDK Mission Control also features a tool to send diagnostics command requests to the Java virtual machine, as well as extra plugins for DTrace recording and heap dump analysis.
With advanced monitoring, data collection and diagnostics tools, the JDK Mission Control allows developers to collect data to actively and closely monitor the JVM virtual machine and running Java applications. It is a must-have tool for expert Java developers who need to make sure their applications are running as they should.
What's new in JDK Mission Control (JMC) 8.3.1:
- JMC 8.3.1, when run as an Eclipse Plug-in, requires Eclipse 4.24 or later. To install JMC as a plug-in in Eclipse, follow the instructions provided at JDK Mission Control for Eclipse. Ensure that you run Eclipse on JDK 11 or above.
JDK Mission Control (JMC) 8.3.1
add to watchlist add to download basket send us an update REPORT- PRICE: Free
- runs on:
-
Windows 11
Windows Server 2019
Windows Server 2016
Windows 10 64 bit
Windows Server 2012 R2
Windows Server 2012
Windows 8 64 bit - file size:
- 91.2 MB
- filename:
- jmc-8.3.1_windows-x64.zip
- main category:
- Programming
- developer:
- visit homepage
ShareX

4k Video Downloader

Windows Sandbox Launcher

calibre

7-Zip

Microsoft Teams

Context Menu Manager

Zoom Client

Bitdefender Antivirus Free

IrfanView

- Zoom Client
- Bitdefender Antivirus Free
- IrfanView
- ShareX
- 4k Video Downloader
- Windows Sandbox Launcher
- calibre
- 7-Zip
- Microsoft Teams
- Context Menu Manager