A powerful scientific/engineering data visualization and analysis tool. #Scientific analysis #Graph plotter #Data visualization #Analysis #Graph #Plotter
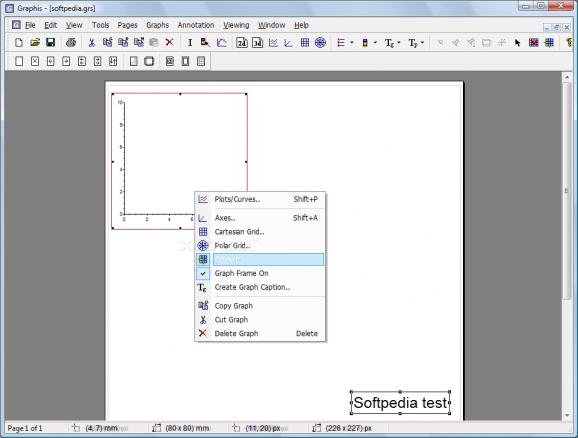
Graphis software was designed to be a powerful scientific/engineering data visualization and analysis tool. At the core of its functionality is the ability to create both tabular and analytical curves. Tabular curves can be used to plot data held in tabular form, while analytical curves can be used to plot mathematical expressions.
Tabular curves are created in Graphis by entering data manually into a curve's table, by pasting it from another application such as Excel, or by importing it from data previously imported into a Graphis Spreadsheet. Graphis spreadsheets allow data to be imported from character-delimited text files using an Excel-like data import feature
Here are some key features of "Graphis":
■ 15 2D (1 independent variable) Plot Types consisting of nine "visualization" plot types, allowing creation of line, area, bar, contour, text and and error bar plots. Six "data analysis" plot types are available for plotting statistical distributions, histograms, probability plots, box plots, and for curve fitting. 2D curves can be plotted in cartesian, polar or parametric coordinates. ■ 12 3D (2 independent variables) Plot Types allowing creation of surface plots, bar plots, line plots, scatter plots, 3D object plots, and mesh plots The 3D object plot allows common 3D objects such as cubes, cylinders and spheres to be positioned in 3D space, while the mesh plot provides the capability to draw any 3D object which can be defined as a set of vertices and elements. A wide range of of options is available within the plot types. For example, surfaces can be colourmapped, texture mapped, transparent, display contours, and have up to 8 translate/rotate/scale operations applied to them. Annotation can be added to a 3D graph using a 3D text plot. 3D curves can be plotted in cartesian, polar, cylindrical or parametric coordinates. ■ Nonlinear Regression. In addition to the linear regression provided by the Graphis' standard regression plot, Graphis provides a full multidimensional nonlinear regression tool. ■ Analytical Curve Definition. Curves can be defined by entering expressions into Graphis. This feature is implemented using the VBScript scripting language, but this is largely transparent to the user. For example, to plot sin(x), simply enter y = sin(x). A curve defined in this way may be as simple as one line, or may consist of a large number of lines. Complex formulae can be evaluated with knowledge of just a few basic scripting rules. You can create your own library of VBScript functions in a text file which Graphis loads automatically. These functions can then be called when defining a Graphis curve ■ Tabular Curve Definition. Tabular curves are those for which the data is entered into a table. The data for a tabular curve may be entered directly into its table, or may be imported from another source. To aid in this process, Graphis provides spreadsheets into which data can be imported from character - delimited text files using an Excel-like data import feature. Analytical and tabular curves can be plotted on the same graph allowing comparison of empirical and analytical data ■ Colourmap Editor. In addition to providing "built-in" colourmaps, Graphis provides a colourmap editor tool which can be use to create colourmaps based on either RGB or HSL components ■ Full control of all graphical elements, e.g. values of axis extents and divisions, colour and font of axis labels and titles, colour and settings for grid, walls, legend, title, colour key, graph background. In addition to the automatic axis tick labelling provided by Graphis, you can add your own ticks and tick labels at arbitrary positions. Log scaling and Date/Time Axis Labelling is available on 2D graphs ■ High Quality OpenGL Graphics is used for 3D graphs. Interactive manipulation of 3D graph quantities such as viewing position, scaling and lighting is provided
Limitations:
■ 30 days trial
Graphis 2.9.35
add to watchlist add to download basket send us an update REPORT- runs on:
- Windows All
- file size:
- 30.9 MB
- filename:
- Graphis2935Setup.exe
- main category:
- Science / CAD
- developer:
- visit homepage
Bitdefender Antivirus Free
IrfanView
Microsoft Teams
ShareX
4k Video Downloader
Windows Sandbox Launcher
Context Menu Manager
calibre
Zoom Client
7-Zip
- calibre
- Zoom Client
- 7-Zip
- Bitdefender Antivirus Free
- IrfanView
- Microsoft Teams
- ShareX
- 4k Video Downloader
- Windows Sandbox Launcher
- Context Menu Manager
