Simulate the Hertzsprung–Russell (HR or H-R) diagram for groups of stars. #Hertzsprung–Russell Diagram #Stellar luminosity #Stellar temperature #Hertzsprung–Russell #Diagram #Stellar
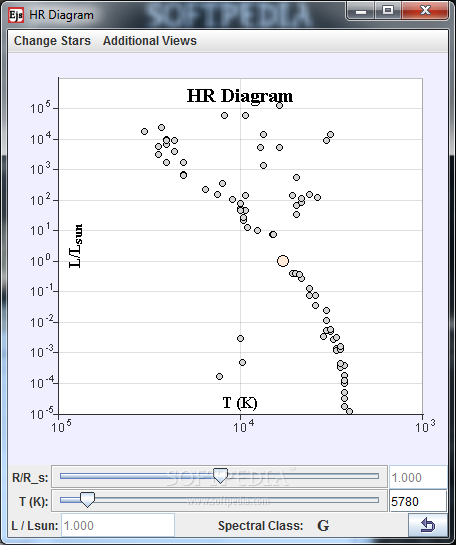
This program simulates the Hertzsprung–Russell (HR or H-R) diagram for groups of stars. The diagram is a scatter plot of stellar luminosity vs. stellar temperature. The luminosity of stars is proportional to R2 T4., and for Main Sequence stars, their luminosity is also proportional to M3.5. Since the range of stellar luminosities and stellar temperatures is so large, the plot uses a log-log scale.
The diagram is a way to understand stellar evolution: stars spend most of their lives on the Main Sequence (the main downward sloping line on the diagram), while older giant stars are found above this line to the right and white dwarfs below this line to the left. The HR diagram shows nearby stars, bright stars, and a user-defined star. Give HR Diagram a try to fully assess its capabilities!
System requirements
- runs on:
- Windows All
- file size:
- 1.1 MB
- filename:
- ejs_astronomy_hr_diagram.jar
- main category:
- Science / CAD
- developer:
- visit homepage
Windows Sandbox Launcher

Microsoft Teams

Context Menu Manager

7-Zip

ShareX

Bitdefender Antivirus Free

IrfanView

Zoom Client

4k Video Downloader

calibre

- Zoom Client
- 4k Video Downloader
- calibre
- Windows Sandbox Launcher
- Microsoft Teams
- Context Menu Manager
- 7-Zip
- ShareX
- Bitdefender Antivirus Free
- IrfanView