Allows curve fitting based on non-linear regression, data analysis and treatment, and features basic statistics and graph plotting tools. #Curve fitting #Nonlinear regression #Function graph #Regression #Curve #Correlation
Statistics comes with various methods and instruments that allow the in-depth analysis of data sets to view trends and generate estimations and predictions. Like in any other field, graphical representations in statistics are more eloquent to the reader: a graph that reveals the evolution of a variable might say more than a table full of values. Keeping that in mind, LAB Fit delivers a full-featured curve fitting tool, also bringing to the table additional statistical tools for data analysis.
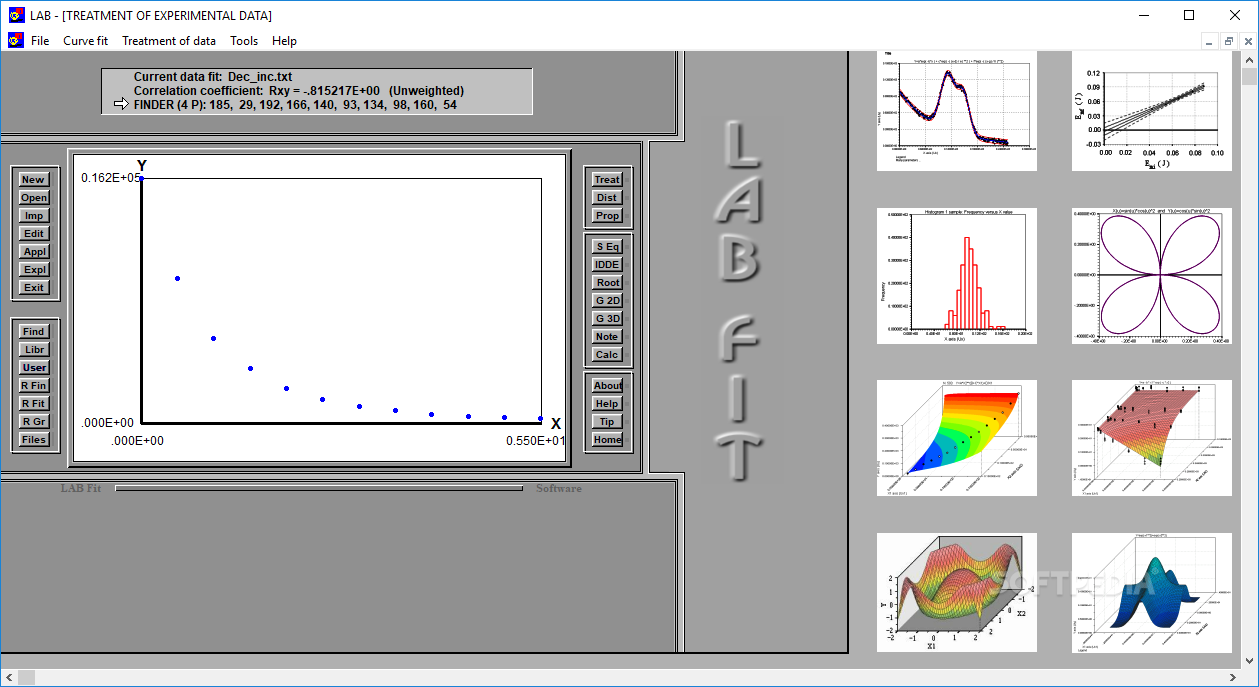
While easy to use and quite intuitive, LAB Fit's interface has an outdated look and, annoyingly enough, it does not behave as expected when resized. Overlooking the design flaws, having all the functions within the main window is helpful.
LAB Fit comes with a collection of data sets that you can load to check out its features, but you can also create a new data set from scratch by entering values for the X and Y axis, but not before choosing the number of independent variables. The data points on the 2D graph are generated almost in an instant. Unfortunately, there is no way for you to resize the graph or zoom in and out. Moreover, the graph cannot be exported, which is a major drawback.
LAB Fit features a menu dedicated to curve fitting that relies on non-linear regression to find the most suitable fit to the data points in your graph. Thanks to its algorithms, LAB Fit can always find an exact or an approximate model. If you are familiar with Fortran, you can write the function yourself.
The correlation coefficient is automatically calculated by LAB Fit and displayed within the main window. There are various other statistical tools at your disposal, including a histogram generator, a probability distribution calculator, and an error propagation assessment tool.
Also, LAB Fit features options to solve certain math problems, such as a system of linear equations, derivatives and integrals, differential equations, roots of functions, and more. Both 2D and 3D graphs can be plotted with LAB Fit and, this time, the drawing can be saved or printed.
The LAB Fit Curve Fitting Software can be of help to those who must analyze data sets and solve various problems. Although it does not get an "A" in design and feature set, LAB Fit works as expected with the tools it has and can prove to be a handy tool to statisticians, students, and data analyzers.
What's new in LAB Fit Curve Fitting Software 7.2.50:
- Corrected bugs in Windows 10
LAB Fit Curve Fitting Software 7.2.50
add to watchlist add to download basket send us an update REPORT- runs on:
-
Windows 10 32/64 bit
Windows 8 32/64 bit
Windows 7 32/64 bit
Windows Vista 32/64 bit
Windows XP 32/64 bit - file size:
- 4.3 MB
- filename:
- LABFit.zip
- main category:
- Science / CAD
- developer:
- visit homepage
Bitdefender Antivirus Free

calibre

IrfanView

Zoom Client

Context Menu Manager

7-Zip

Microsoft Teams

4k Video Downloader

ShareX

Windows Sandbox Launcher

- 4k Video Downloader
- ShareX
- Windows Sandbox Launcher
- Bitdefender Antivirus Free
- calibre
- IrfanView
- Zoom Client
- Context Menu Manager
- 7-Zip
- Microsoft Teams