14 DAY TRIAL //
 As Macs are getting faster and faster, and the numbers on the processors are getting bigger and bigger, they are also getting hotter. Not only in a hype/trend/fad sense, but also in the old Celsius and Fahrenheit sense. And the more you run intensive tasks and the longer you run them, the hotter it's going to get inside that box. Naturally, reducing the heat inside the box is a desirable thing. But in order to be able to do anything about it you fist need a way to measure it.
Temperature Monitor is a utility that will display all the information that can be gathered from the sensors inside your Mac. Nearly all recent Macs have some method of measuring the processor temperature; some have a dedicated temperature sensor, while others use a sensing feature of the PowerPC processor itself. These sensors must be accessible to OS X without any third party drivers, if Temperature Monitor is to be able to work with them.
Unfortunately, there is no list of supported macs or anything of the sort, not even predictions are possible since, as the developers say, Apple very often releases "silent product updates", where the hardware equipments of some models are changed but the names are not (specifications are "subject to change without notice"). The particular graphics card and hard disk configuration used is also important because these parts can include independent sensors, too.
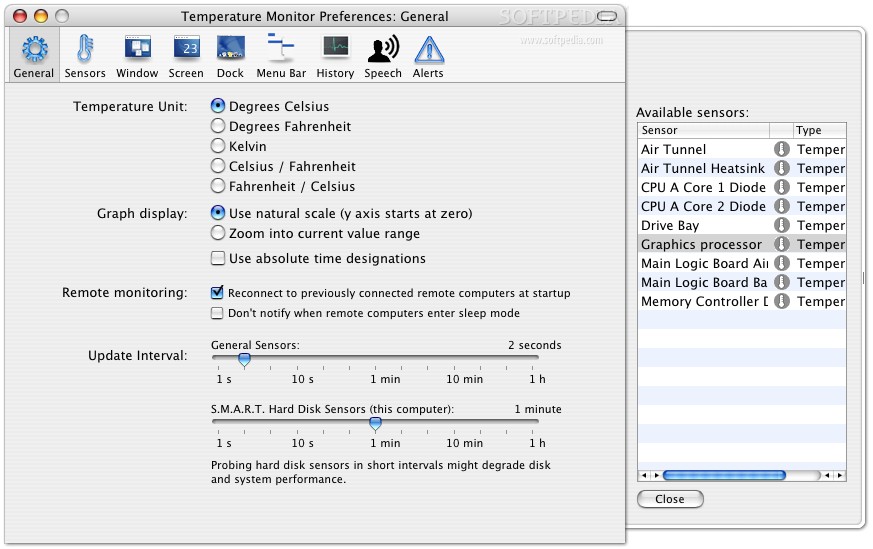
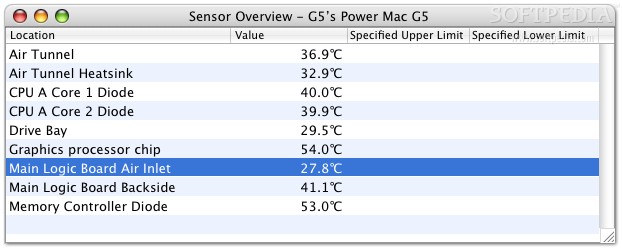
Getting information The System Overview offers pretty much the same information as System Profiler, only a lot less of it, many devices being filtered out because you do not need them. The fist useful information you encounter is in the Sensor Overview window, where you can see a list of all the currently detected sensors and their readings. Double clicking any of these sensors will bring up a detailed information window where you can see the location, hardware, category, type, precision, accuracy and specified limits. In the Hard Disk Monitoring Information window you can see how your Xserve drive modules are doing. If you don't have any of that, you can see your disk drives in the Drive Overview window. You can see the extreme values of the sensors, over a period of time of your choosing, in order to see which components remain largely unaffected over time.
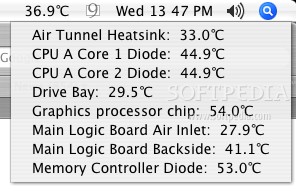
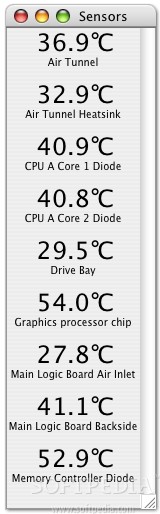
To make everything simpler, you can open a window in which all available sensors are shown. You can change this list to your liking from the preferences, as well as tweak the way it looks. This window, however useful, is only mere window and is subject to window cluttering and covering. For those widget inclined, you can also activate a transparent, always on top floater with any sensors you like, that is fully customizable. And for those with limited screen space, there is also a menu item that can open a menu with all the sensors and their last readings.
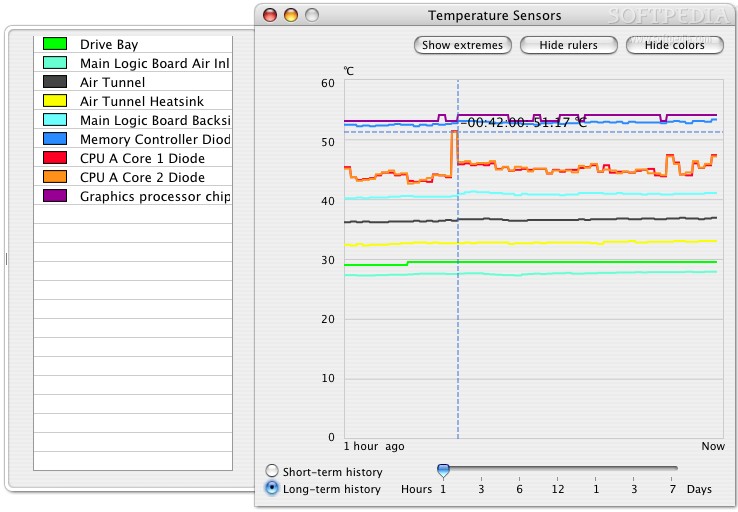
The bigger picture Perhaps the most useful feature of Temperature Monitor is the History Window here you can see a graph representation of the sensor readings over time. This is perfect to see how certain tasks affect the temperature of your components, or how different placements of your box affect the effectiveness of the cooling.
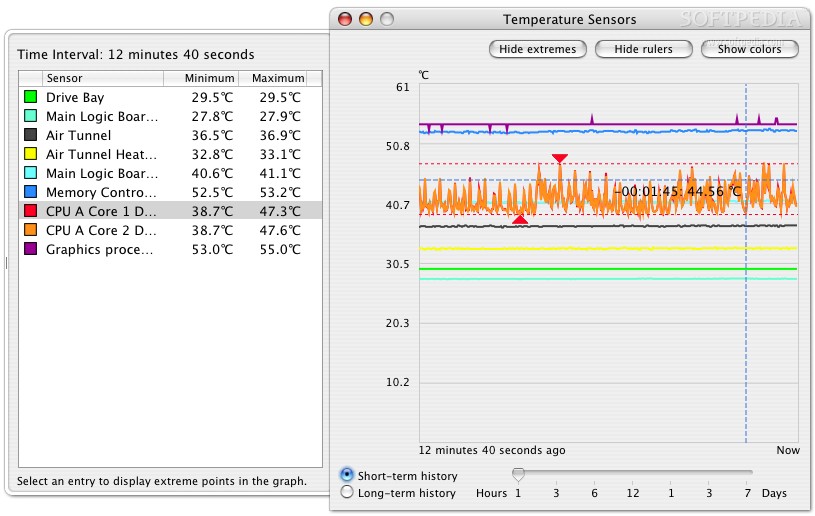
There are two ways of displaying this information. The short term mode shows the previous 380 readings for each sensor. The time period for this mode is dependent on the update interval. The information gathered to make this mode work is lost upon exiting the program. The Long Term mode lets you specify a custom time interval ranging from one hour to one week. Readings for every sensor are stored every minute, and are kept even over application quit.
Each sensor can be color coded to make reading the display easier, and there is a drawer that can be opened to show a list of each component and its color code. Peak values can be seen in another drawer and can also be shown visually on the graph by selecting a sensor from the drawer. A ruler makes it easy to pinpoint values by dragging the intersecting hairlines and getting time and sensor value for the current location.
How are you doing over there? You can monitor multiple computers at the same time by installing Temperature Monitor on every computer and connecting to them over a network. You can, in theory, monitor an unlimited number of other computers but there are several practical limitations such as bandwidth. The gathering does not have to be direct, and you can have many intermediate information gatherers rather than report to one central hub. When you are monitoring other computers, in most cases, opening a window will open an instance of that window for every computer that is being monitored. In other windows, there is a computer column that makes it possible to distinguish between different machines.
The Good It's great at showing you temperature readings and those of any other sensors it can detect inside your computer. Very customizable and the graph chart is simply great. You can even monitor other computers over a network.
The Bad A bit awkward to use, a large number of windows will be open and if you are monitoring multiple computers it's a bit of a nightmare. Also column sorting and several other interface niceties would make it easier to work with.
The Truth This a great tool overall. It might be a little hard to work with because of all the windows, but it has many great features that make it invaluable as a monitoring tool. If you are looking for the inside dirt on what is going on in that box of yours this is a very good place to start.
Here are some scrrenshots, click to enlarge: