14 DAY TRIAL //
Diagnosis and Information
The WinOptimizer saga does not stop with the various tweaking options and continues with a module for analyzing the hard disk usage, learn details about installed hardware and software, as well as benchmark and online comparison of your system with those of other users.
The three modules included are Disk Space Explorer, System Information and System Benchmark. All three of them support very few settings, as the entire module is about presenting system information to you.
Disk Space Explorer
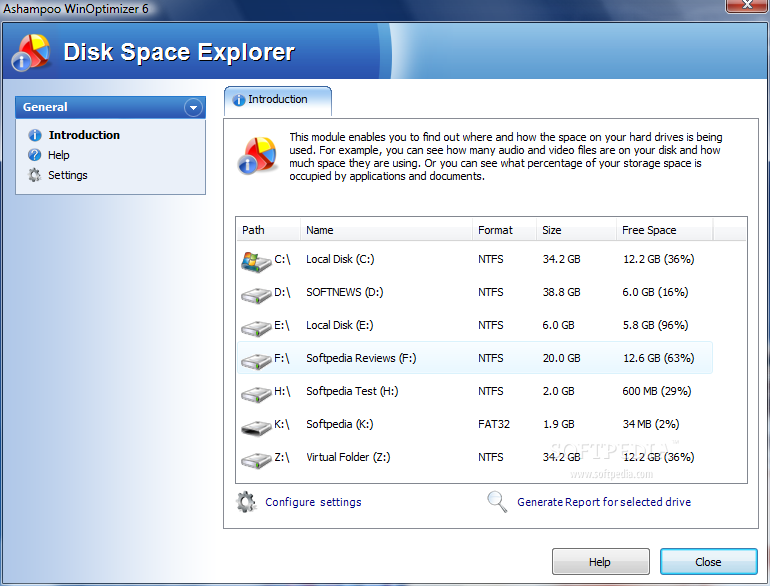
Determining how much of the disk space is occupied could turn into a tiresome task if there's no tool around to give you an exact report on the status. WinOptimizer provides such an instrument capable of feeding you detailed information regarding each drive on the system, removable ones included. You will benefit from file specific charts revealing the type of data available on the volume and the chunk it takes off.
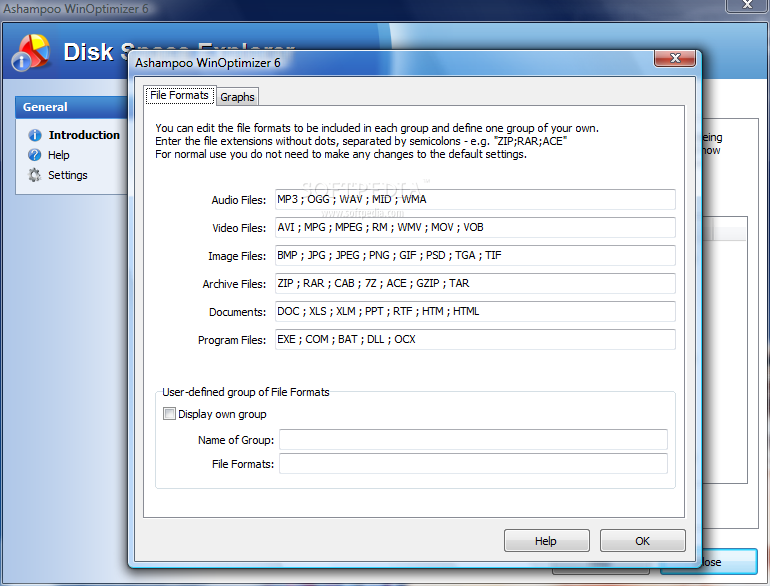
Before generating a report, configure the way all the data is presented. Everything is pretty much reduced to the file extensions you want to be integrating to five different program groups: audio, video, image, archive, documents and program files. The default list includes the most popular types of the six categories, but these can be easily extended.
Also, you can create a custom group of data that can include anything not listed in the above mentioned classes. The options here allow you to name the group, as well as manually add the file types it represents.
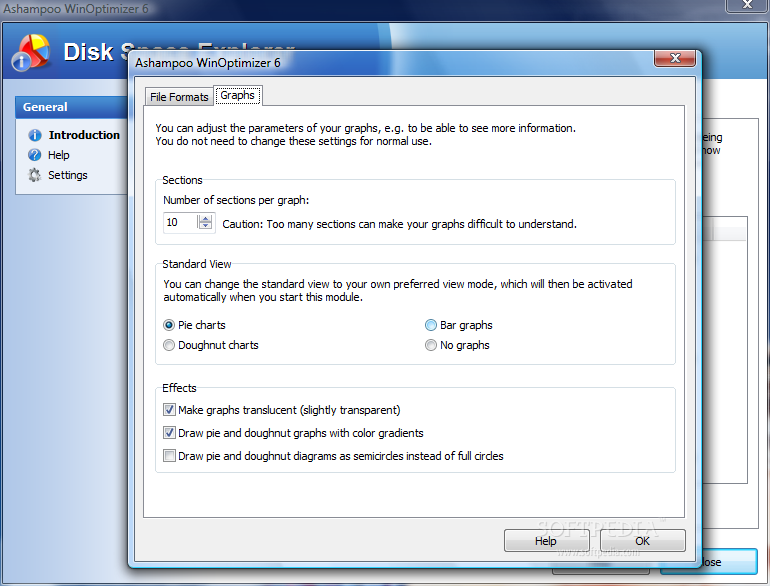
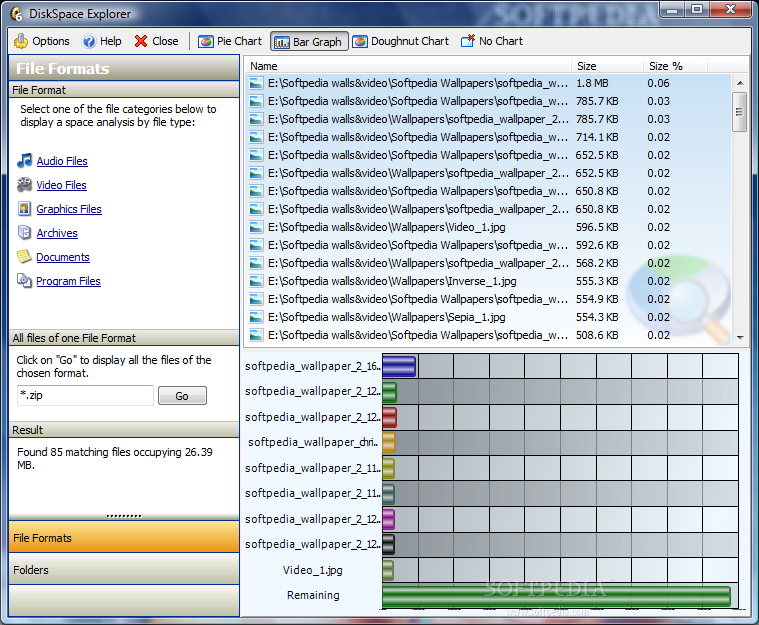
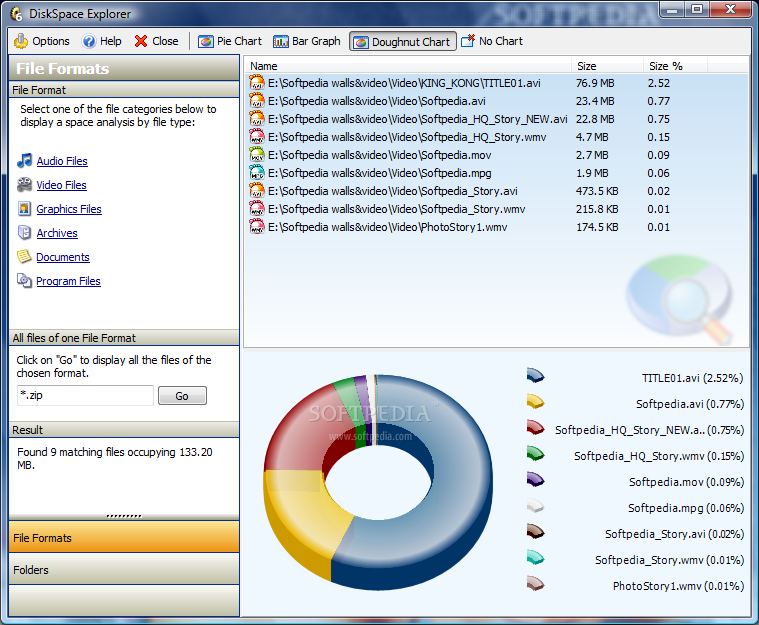
The configuration for the graphs is not thick either and presents settings for the number of sections per each graph (default is 10 and adding plenty of them will give you a hard time reading it), the type of the graphical report and various effects. For graphical representation of the data on the drive, you can choose from pie charts, doughnut charts, bar graphs or no graphs at all.
Effects list lets you make the charts translucent, impose color gradients or display the chart diagrams as semicircles instead of full circles. Once all these settings are made, you can proceed to displaying the actual reports.
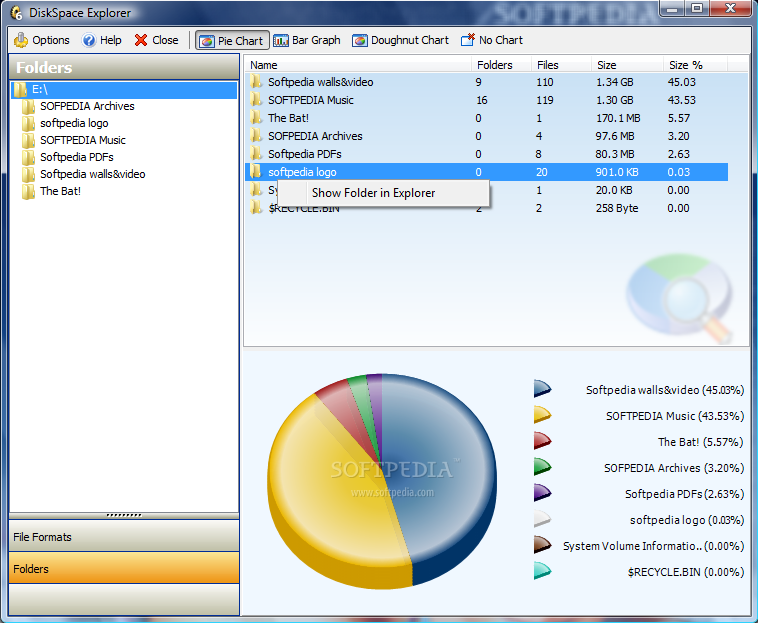
Generating the report will take a bit and the information display is flexible enough to allow toggling between file formats and folders. The legend in the lower right hand corner of the window explains every color.
You can even have a look at all the files of a specific type available on the selected drive, as the report and the graphical representation will be displayed in an instant. All the information can be viewed in all three types of graphs at a time, so you can decide peacefully on the one that suits you best.
System Information
This is the second tool under the Diagnosis and Information module, and as soon as you access it, system scan will begin. The details presented regard the hardware and software installed, but info on drives is present as well.
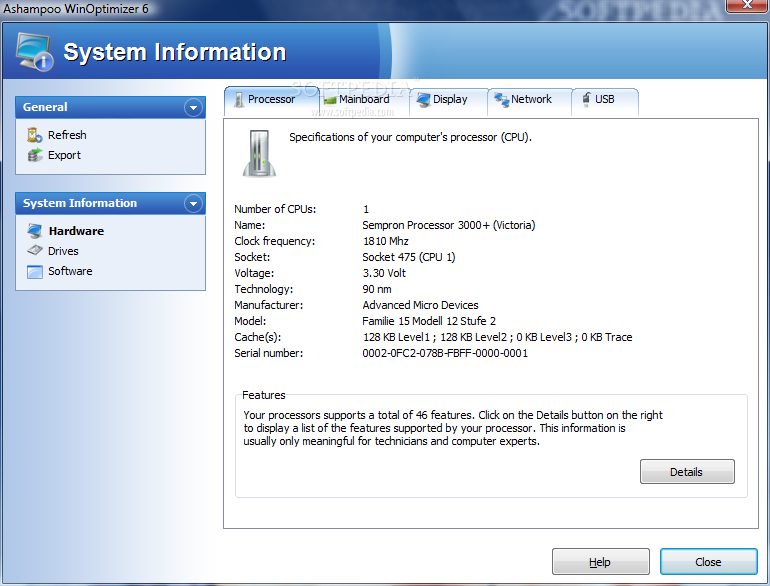
The data on hardware is comprised of the CPU, mainboard, display information, network and USB ports. Processor is the main tab of the menu and here, the application discloses the number of CPUs your system has, the clock frequency, socket, voltage, technology, manufacturer, model, cache(s) and serial number. If this is not technical enough for you, there is a “Details” button in the lower right hand corner of the window, which shows the total number of features your CPU supports. If you are not a technician or hardware expert, the entire list is just a major turn off.
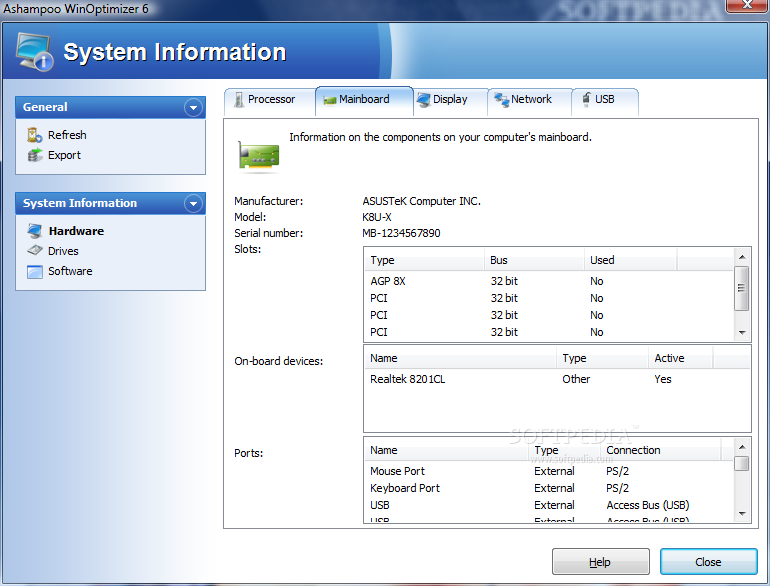
Mainboard data follows pretty much the same pattern and offers useful info, such as manufacturer, model and serial number, as well as a list of on-board devices, slots available and ports. Nothing is configurable because the entire module is informative-only.
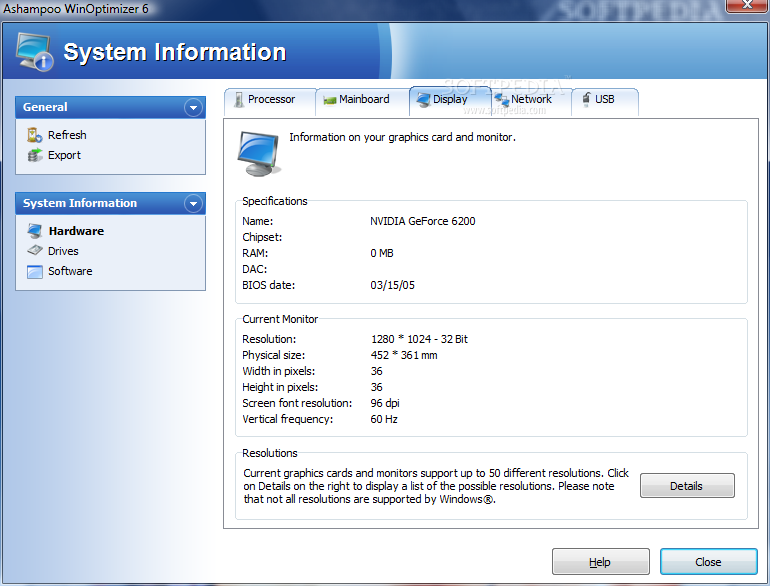
In Display tab, you get the name of the graphical card and chipset should also be present, but in our case its place was empty, as well as RAM and BIOS date. Details like the current monitor settings could not miss: resolution, screen font resolution and vertical frequency. For a complete list of supported resolutions, check the “Details” in the lower right hand part of the screen.
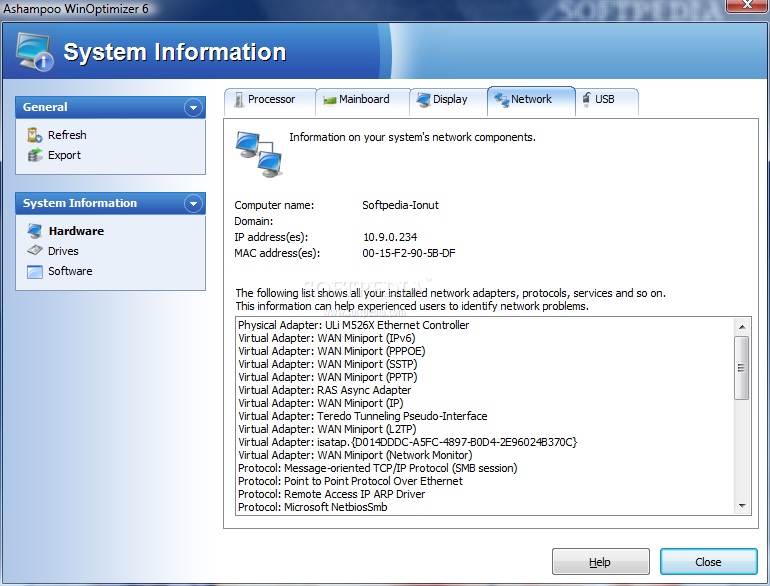
Network tab keeps it as simple as possible, but not without letting you know about the current name of the computer, the domain it pertains to, IP and MAC addresses. Network adapters installed together with protocols and services used are presented in the lower part of the interface. If you are not too keen on network and what's really running, then these types of details will not affect you.
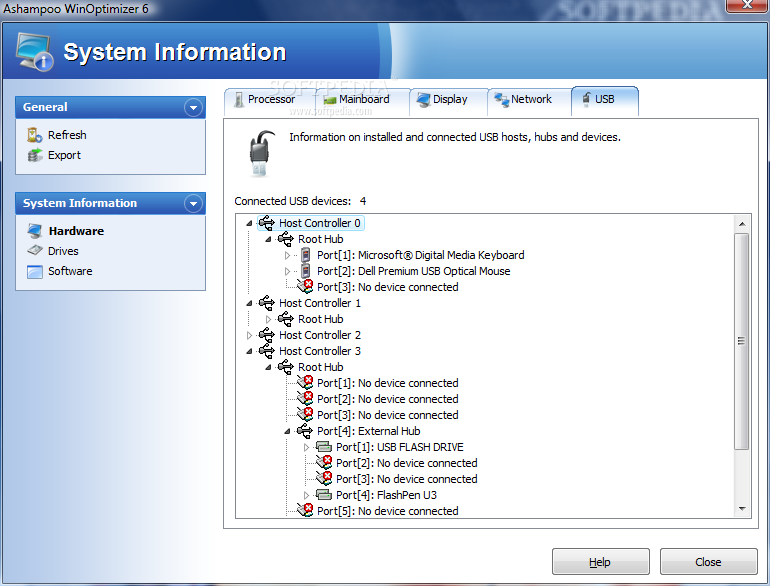
USB ports are the last type of hardware System Information provides details on. You are given the total number of connected USB devices and host controllers (root hubs and ports are also part of the deal) together with data on the devices connected.
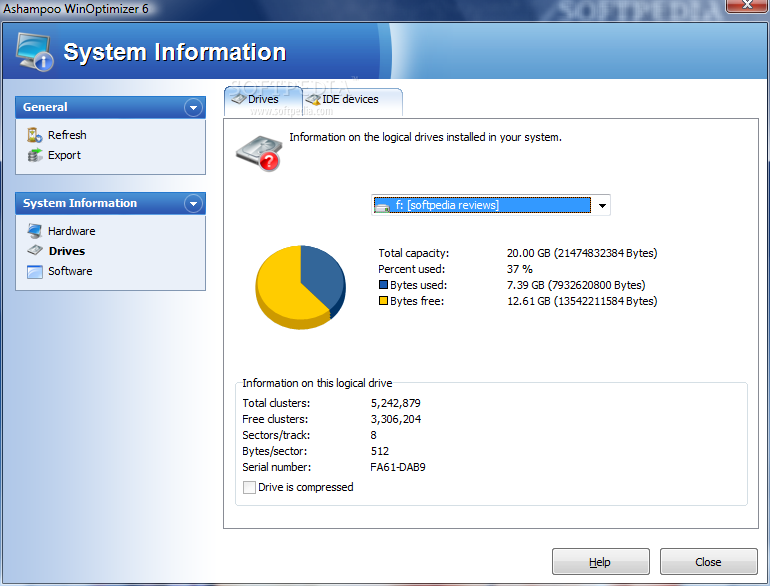
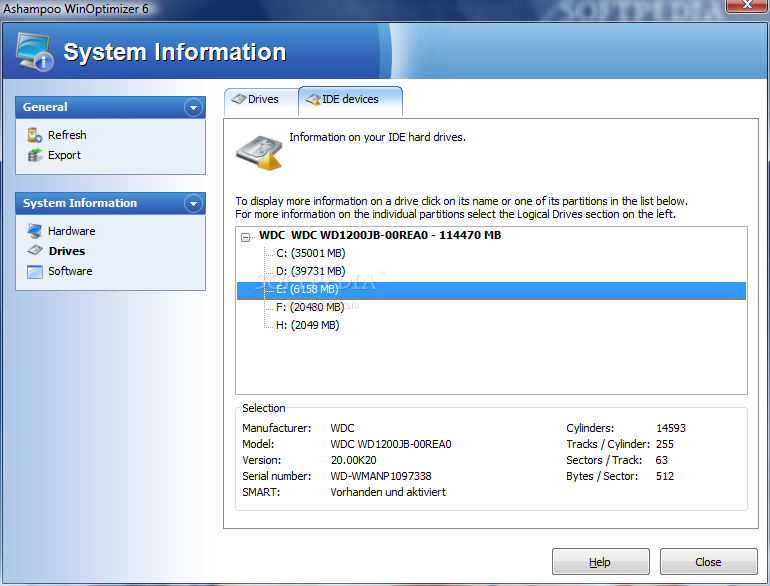
Logical drives on the system do not escape the application that enables you to view broke-down details on total capacity, free space available, total number of clusters, free ones, sectors per track and bytes per sector, plus the serial number. This includes the removable drives.
IDE connected devices have a tab of their own, allowing you to view information on individual partitions such as manufacturers, number of cylinders, version number, bytes/sector or tracks/cylinder. Very important, you can see whether SMART monitoring system is activated or not. If so, SMART attributes can be read by appropriate software and give you an indication on reliability.
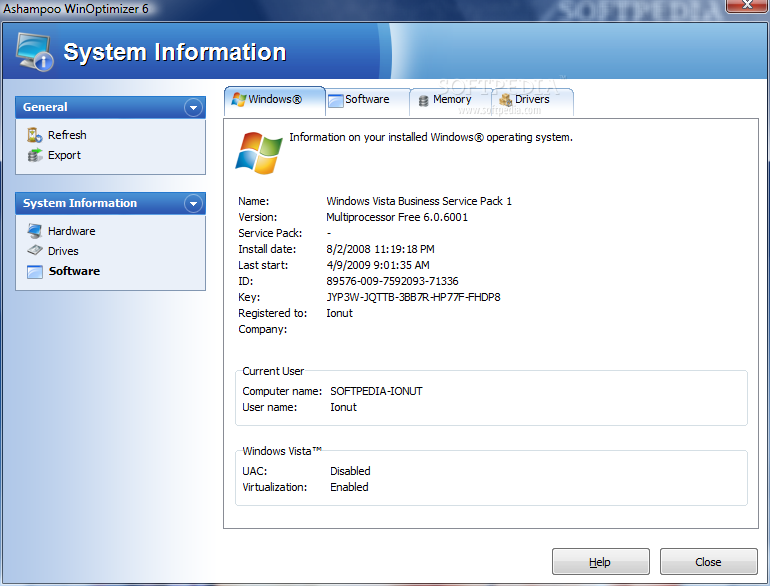
Software is the last section in System Information and displays data on the Windows OS you have installed (even the serial number), date of installation, last start, service pack available, UAC status (on Vista) and name registered under.
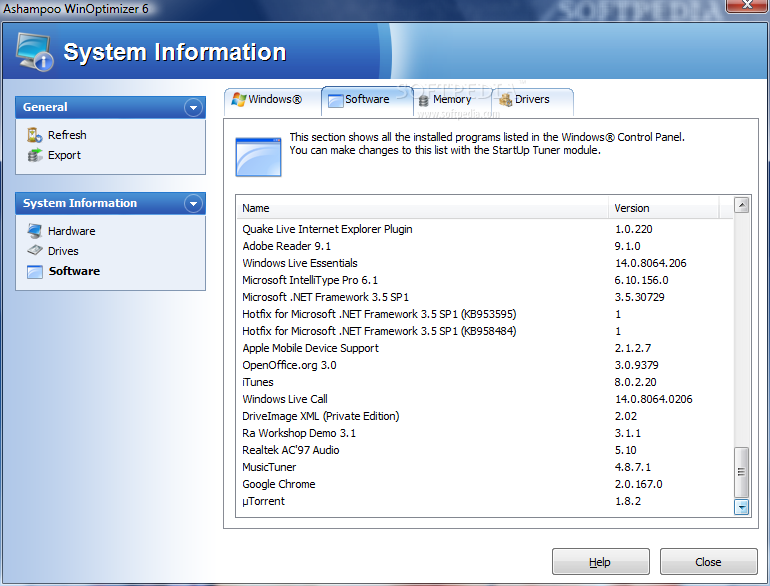
Since you're here, you may as well view the list of installed programs, which is the same from the applet in Control Panel. But compared to Windows' Programs and Features or Add/Remove Programs, you don't have date of installation and size or publisher, only the version number.
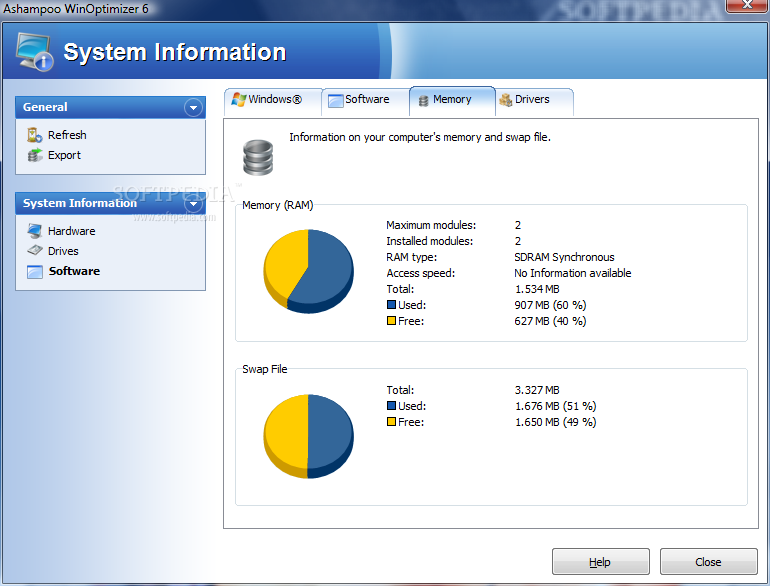
RAM is not left aside, as the program supplies details on the maximum number of modules, how many modules are installed, the type of memory installed, access speed, amount, how much is currently in use and how much there is free. Virtual memory details are available too, giving you the grand total allocated, amount used and how much there is free. All the details in Memory tab of Software menu provide accurate info.
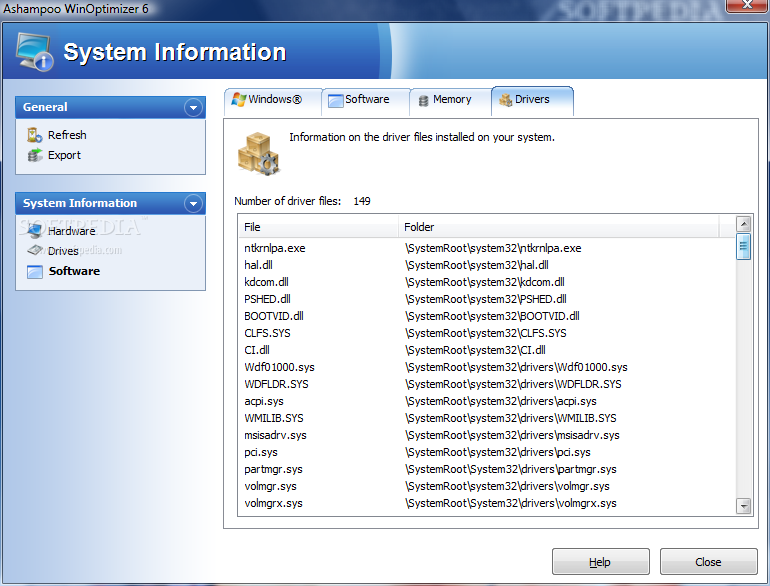
Information about drivers is the last present in System Information application. What you will get is a list of all the driver files installed on the system. Every file is included here; unfortunately, you will not be able to pinpoint which file belongs to which driver. All you're going to get is the full path to the driver file and the total number of files detected.
Besides all the details supplied by System Information, you can also generate an instant HTML report with almost all the data, that will open automatically in a webpage. From the application, there is no possibility to save it, but this action is not impossible because the web browser opening the report allows saving the file to disk in a location of your choice.
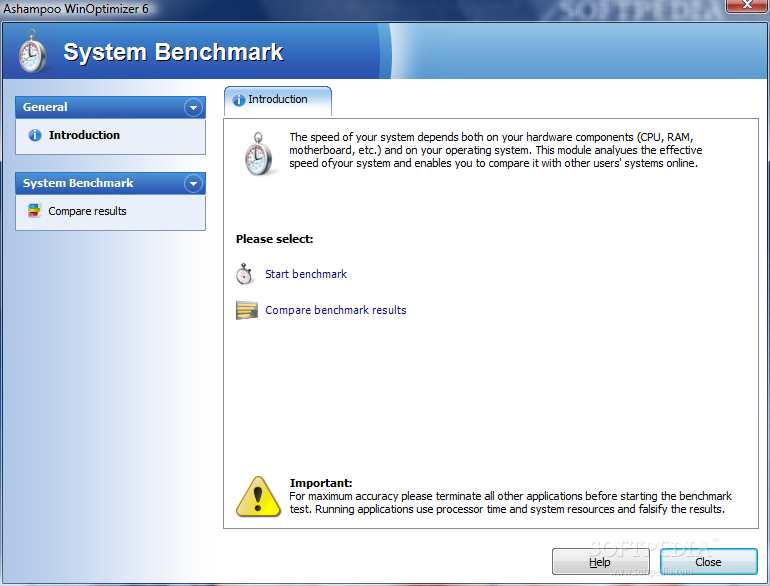
System Benchmark
This is as simple as pressing the button that starts the system assessment process and waiting for the results. There is no configuration to be made but you will have to comply with some conditions for accurate results, like refraining from performing any actions or running any programs during the process, as these will influence the results.
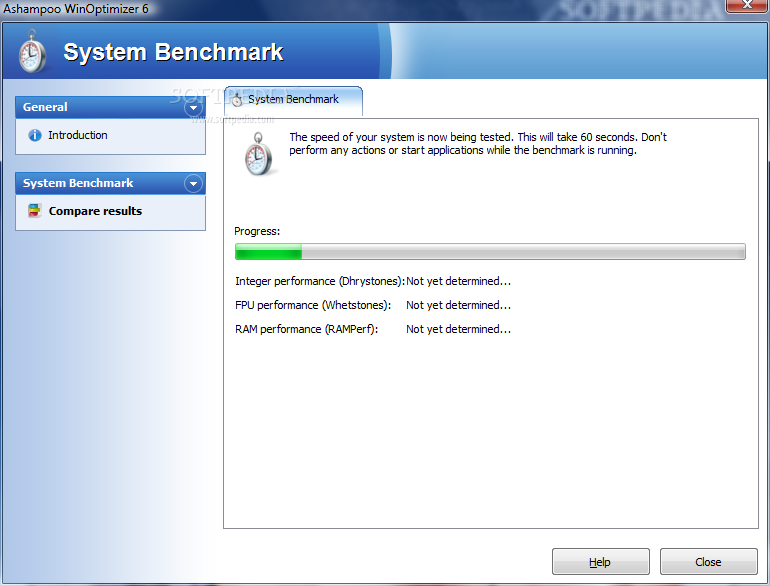
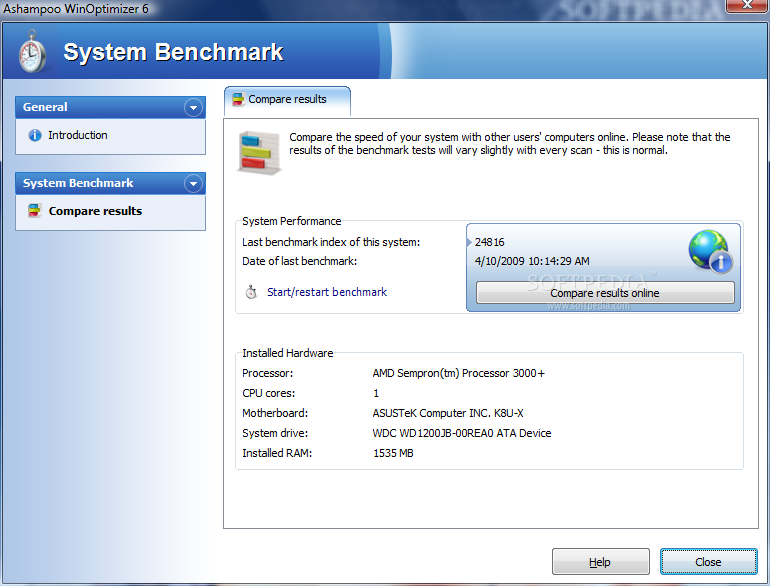
The benchmark test will assess the integer performance, FPU performance and RAM performance in as little time as possible (it won't generally take more than 20-30 seconds). All results are shown in a separate window that gives you the possibility to compare your points online and see the ranking of your system among other Ashampoo WinOptimizer users.
However, in our case, the online comparison did not work on Vista, and only on XP were we able to see the top ratings. But, if you access this link here, you will be able to see all the rankings, and based on your accumulated points, find out where your configuration is situated. Also, clicking on the number of points of any user, you will be able to learn general details on their configuration (CPU, motherboard, RAM and OS).
Skip to a different section: CleanUp System, Optimize Performance, Privacy and Security, Tune System Settings, File Tools, General Conclusions